Rename, format, and sort columns
Renaming, formatting, sorting, hiding, freezing, and reordering columns are Display Changes, one of two separate ways to modify a View. The other is Pipeline Tasks, which transform the data itself. This page covers both and explains how they differ.
Display Changes
Display Changes control how data is presented in your View—column names, number and date formatting, column order, sorting, and visibility. They do not transform the underlying data.
Most Display Changes apply immediately when you make them directly in the data grid. The Display Changes modal is where you review what has been applied and revert individual changes if needed.
Text formatting (changing case or normalizing whitespace) from the Column Menu is not a Display Change. It adds a Text Formatting task to the pipeline.
Rename a column
There are two ways to rename a column:
- Double-click the column header—an inline text field appears, type the new name and press Enter.
- Open the column's 3-dot menu and select Rename Column.
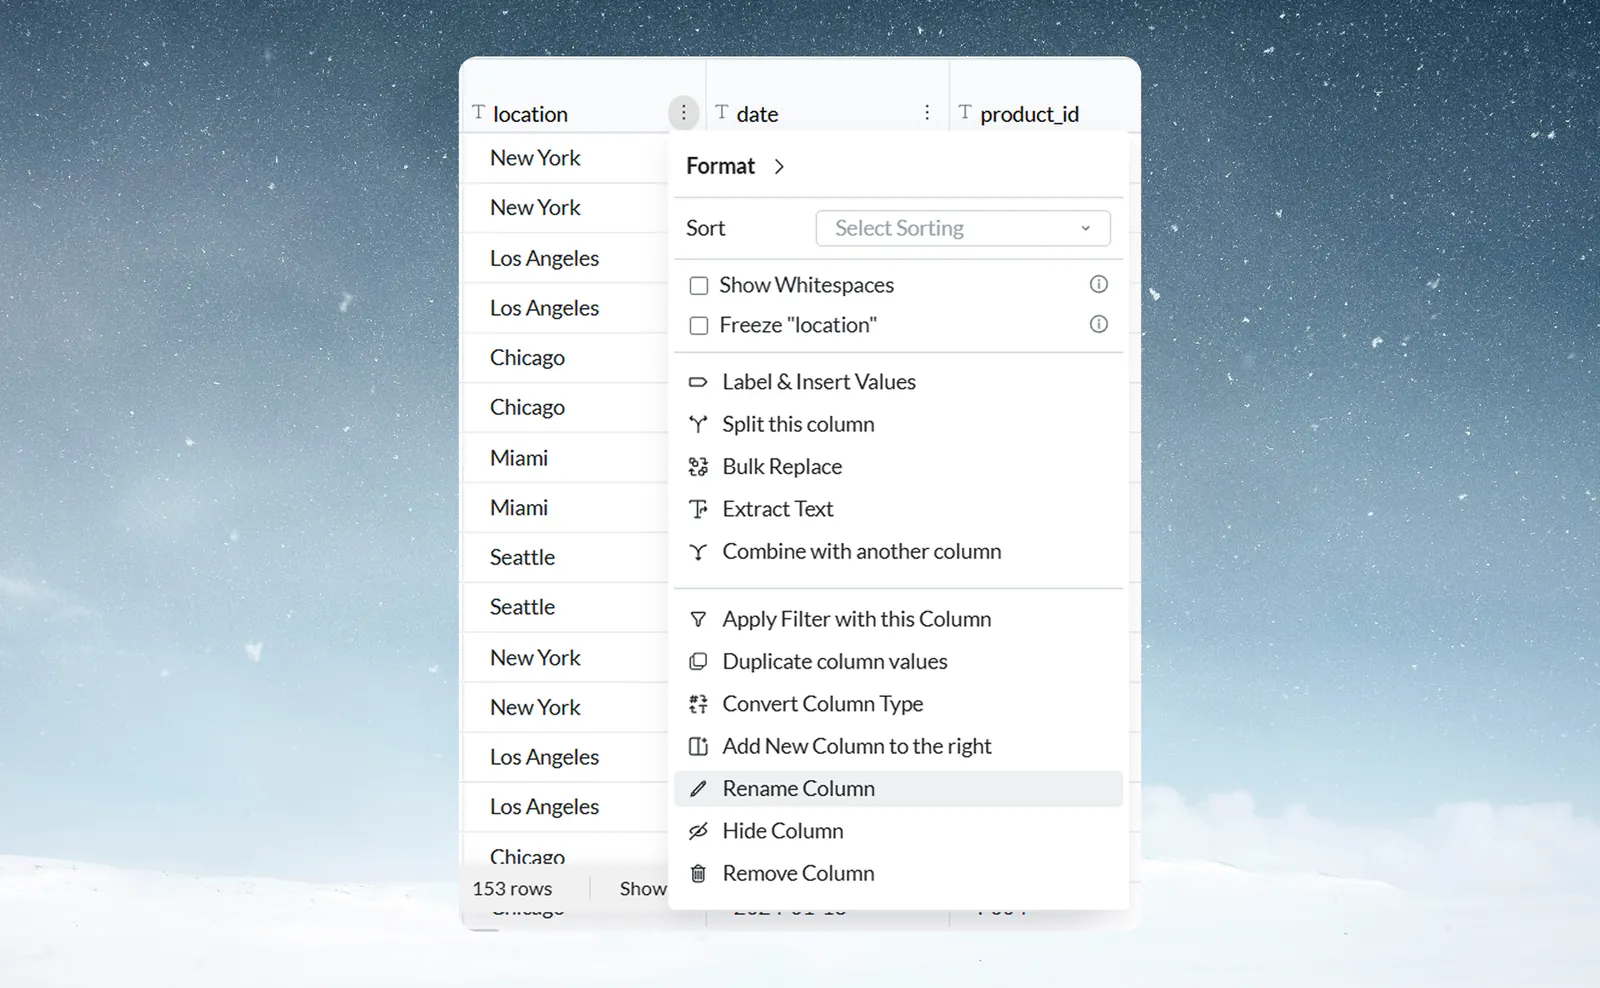
Both methods apply immediately. A renamed column's menu also offers Revert to original column name. Rename Column, Hide Column and Revert to original column name are disabled while any task in the pipeline is in error; fix the failing task first. There is no Rename Column function in the Transform menu—this is the correct and only method for renaming columns in Mammoth.
Other Display Changes you can make from the grid
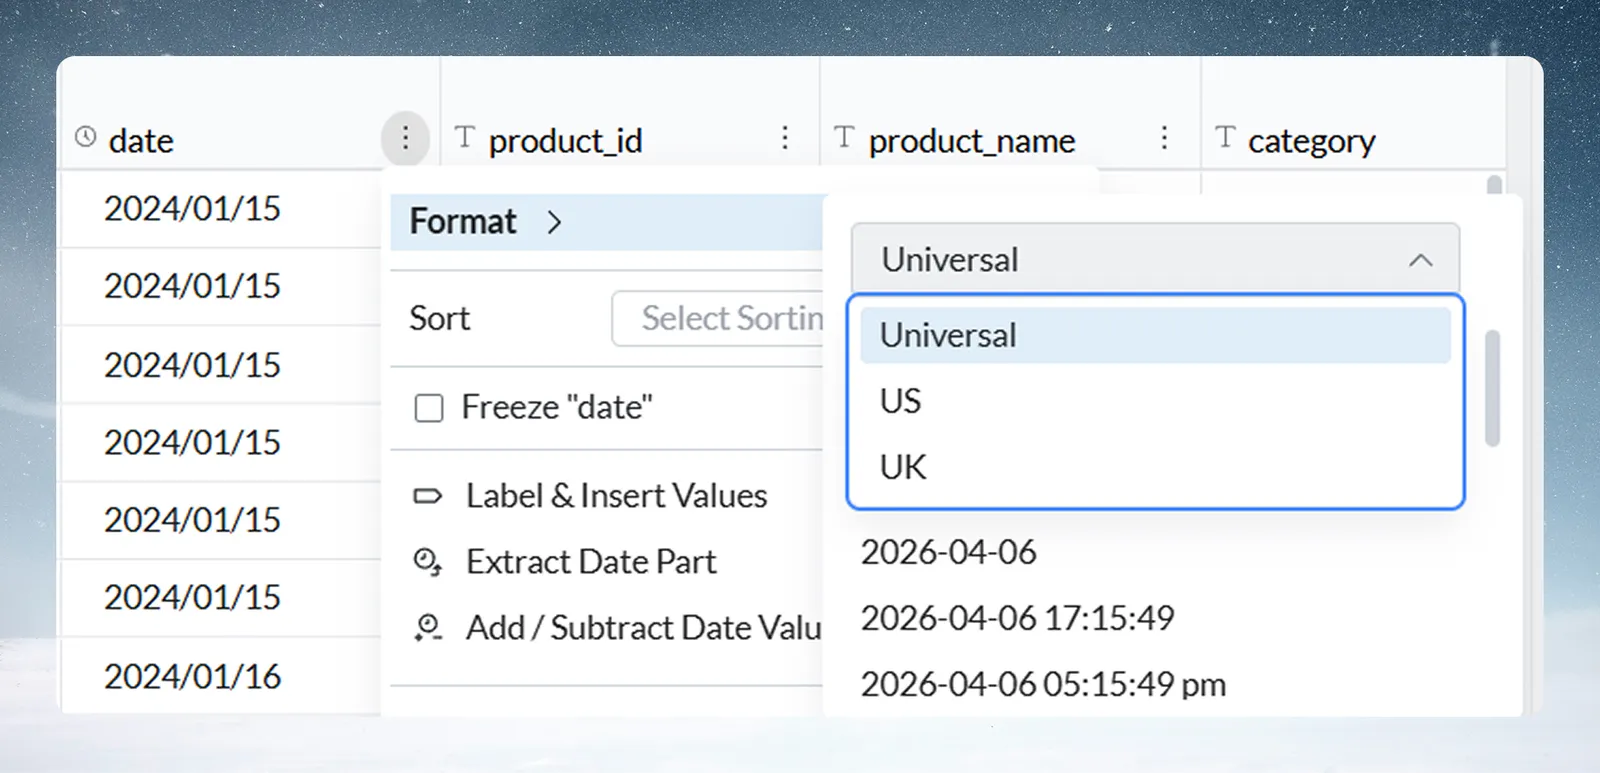
- Format a column—open the column's 3-dot menu. For date columns, select Format and choose from the available display formats. For numeric columns, set the thousands separator, percentage, currency symbol, or decimal precision. Numeric format changes require clicking Apply in the menu.

The same menu for a date column:
-
Sort the grid—open the column's 3-dot menu and choose Ascending or Descending in the Sort dropdown. The sort is saved with the View. The Sort by button in the data grid footer shows the active sort (or "Default") and opens the Sort Columns dialog for sorting by several columns; an X next to it clears the sort without opening the Display Changes modal.

-
Reorder columns—drag a column header left or right to a new position. Applies immediately.
-
Hide a column—open the column's 3-dot menu and select Hide Column. The column is hidden from the grid but remains in the data and is still available in pipeline task dropdowns. Exports leave out hidden columns unless the export's Include hidden columns option is selected.
-
Freeze a column—open the column's 3-dot menu and check the Freeze option to pin the column to the start of the grid so it stays visible when scrolling horizontally.
The Display Changes modal
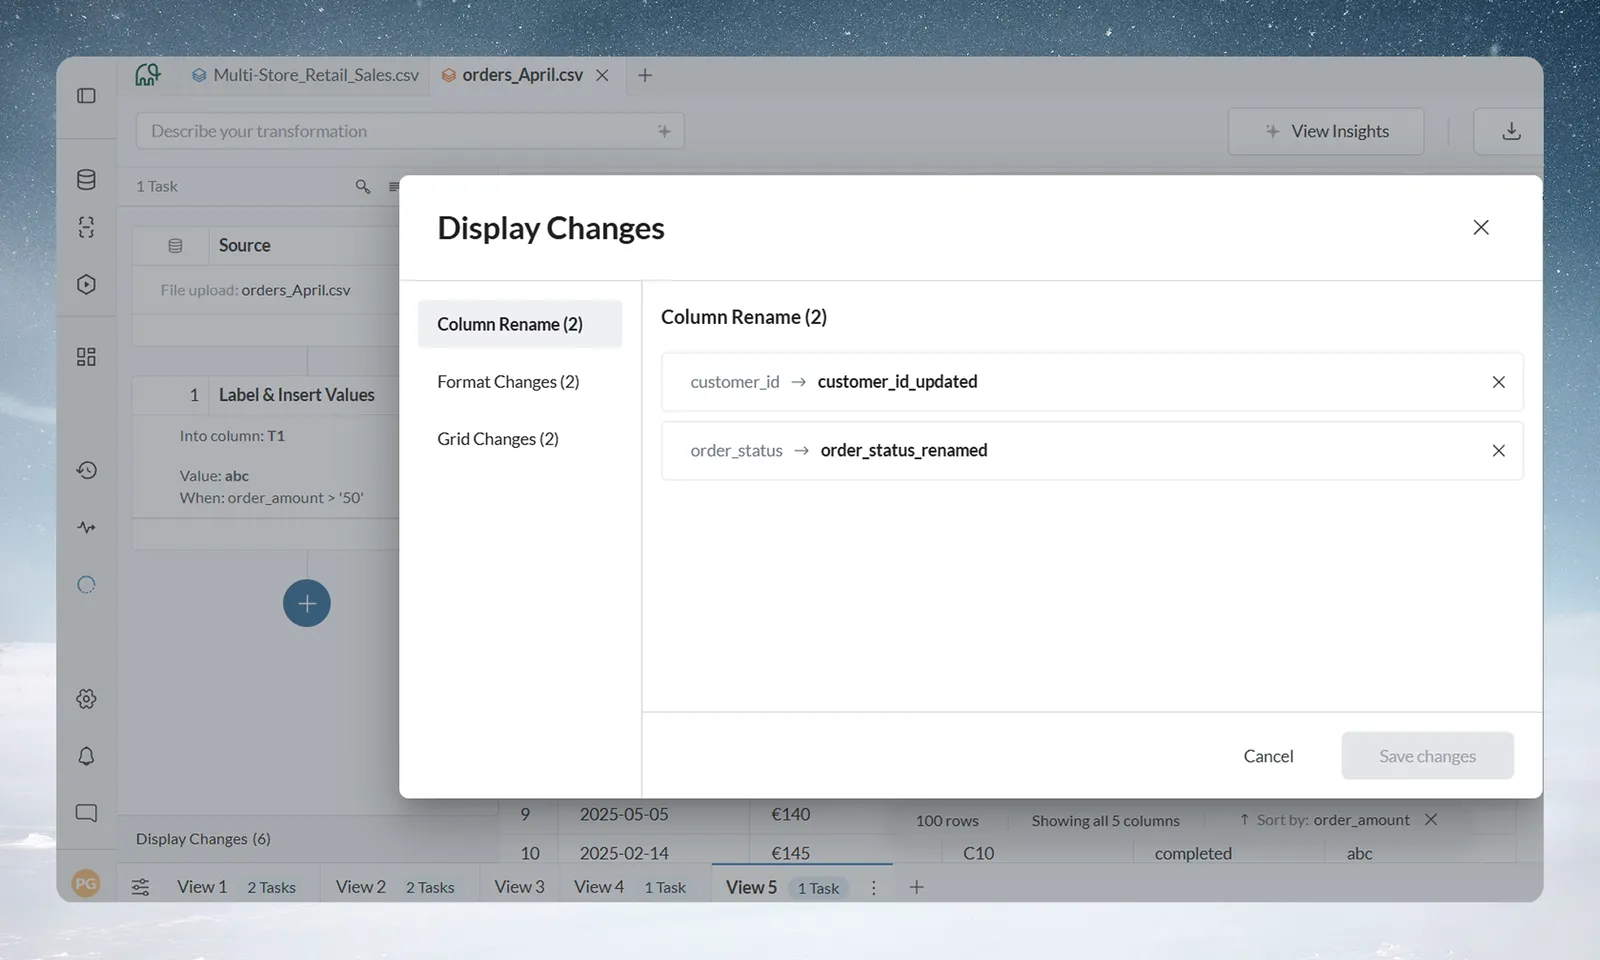
Click Display Changes (n) at the bottom of the Pipeline panel to open the modal. The link appears once at least one Display Change is active, and the number shows how many. Hovering over the link shows a tooltip breakdown—for example, "Column Rename (1), Format Changes (2), Grid Changes (2)."
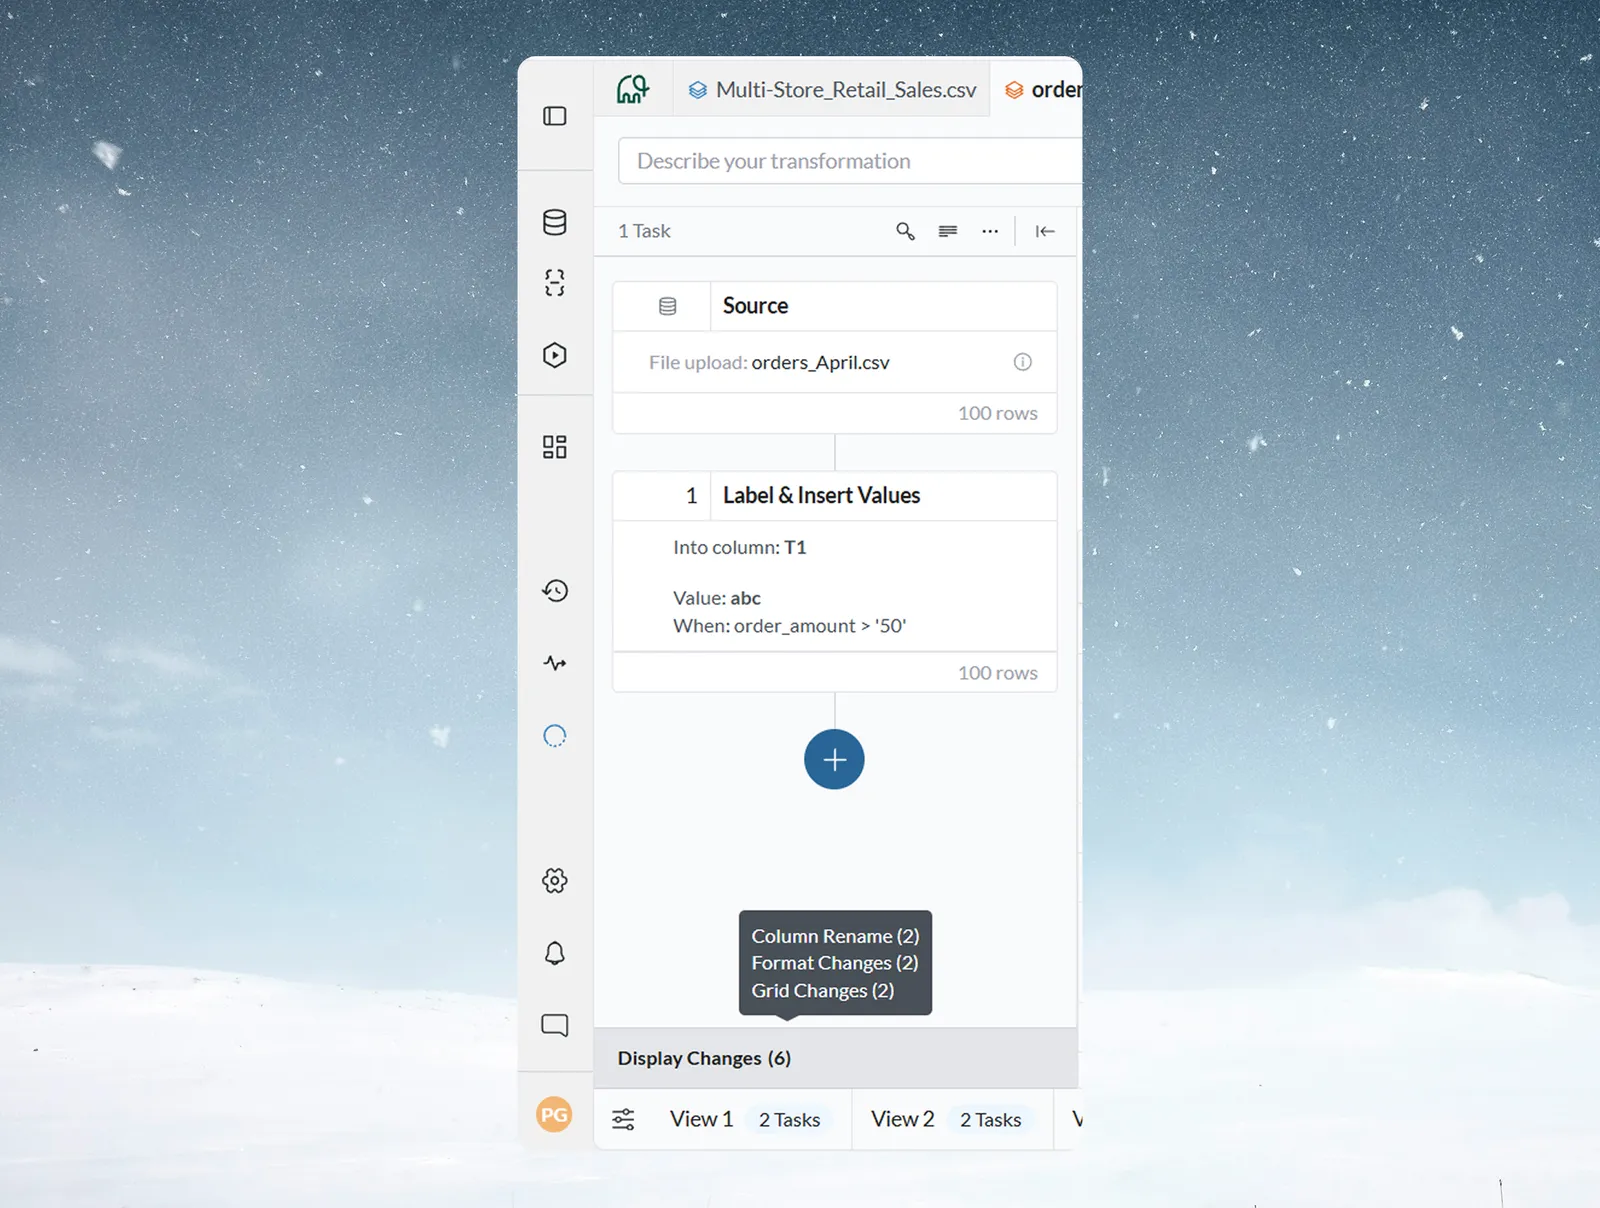
The modal has three sections in a left-hand list:
Column Rename—lists every renamed column showing original name → new name. Each entry has an X to revert it individually.
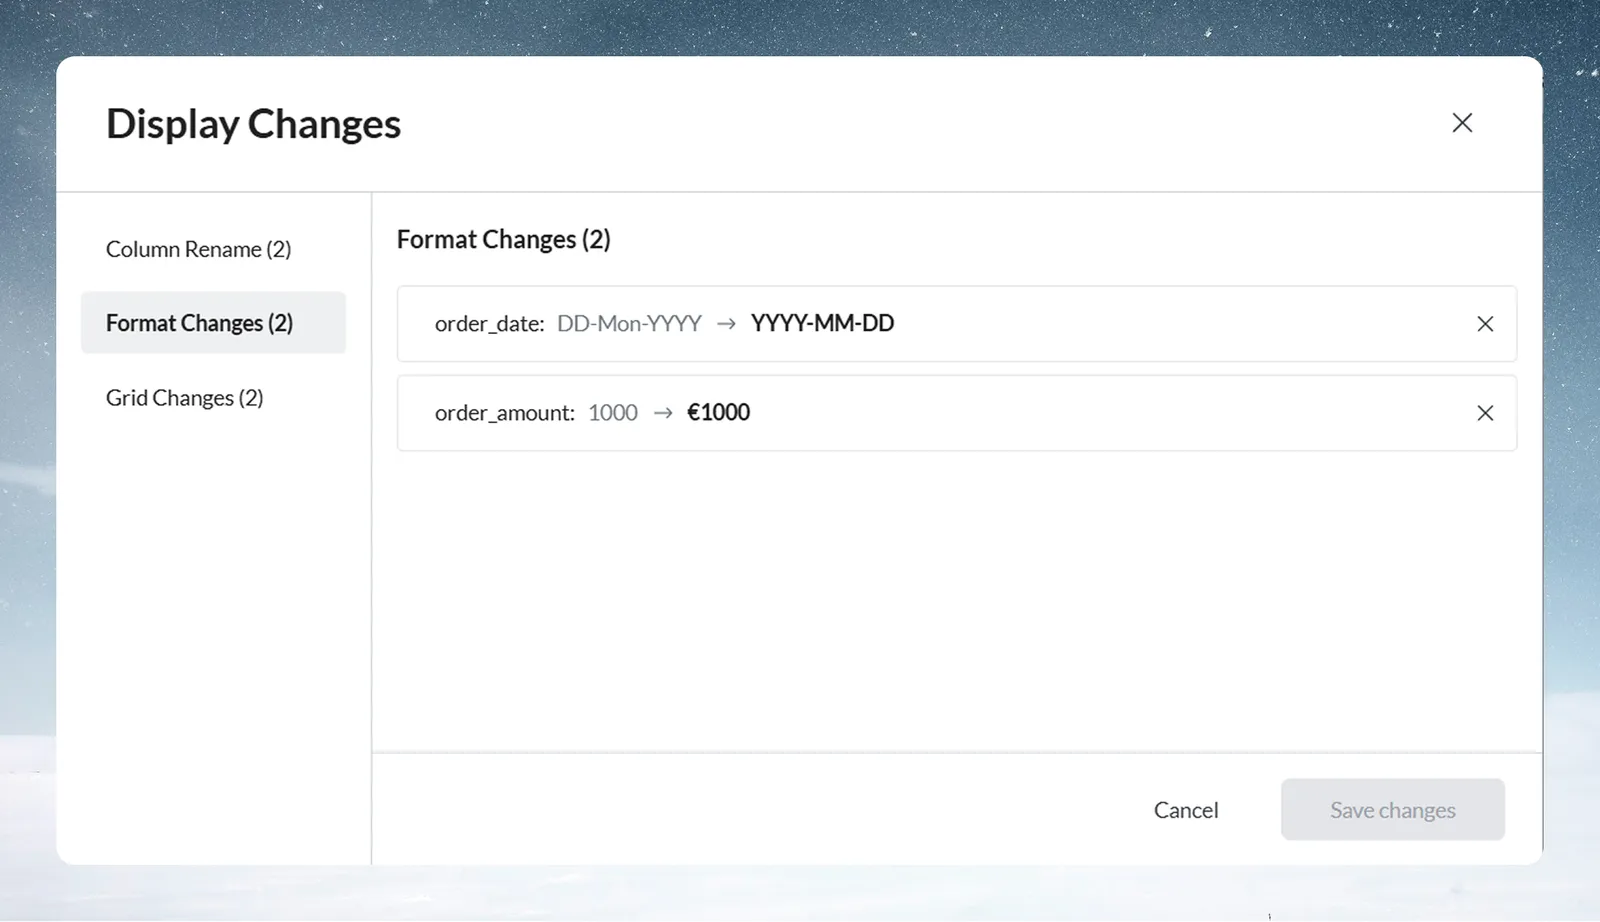
Format Changes—lists every column with a display format applied, showing the before and after. Each entry has an X to revert it individually.
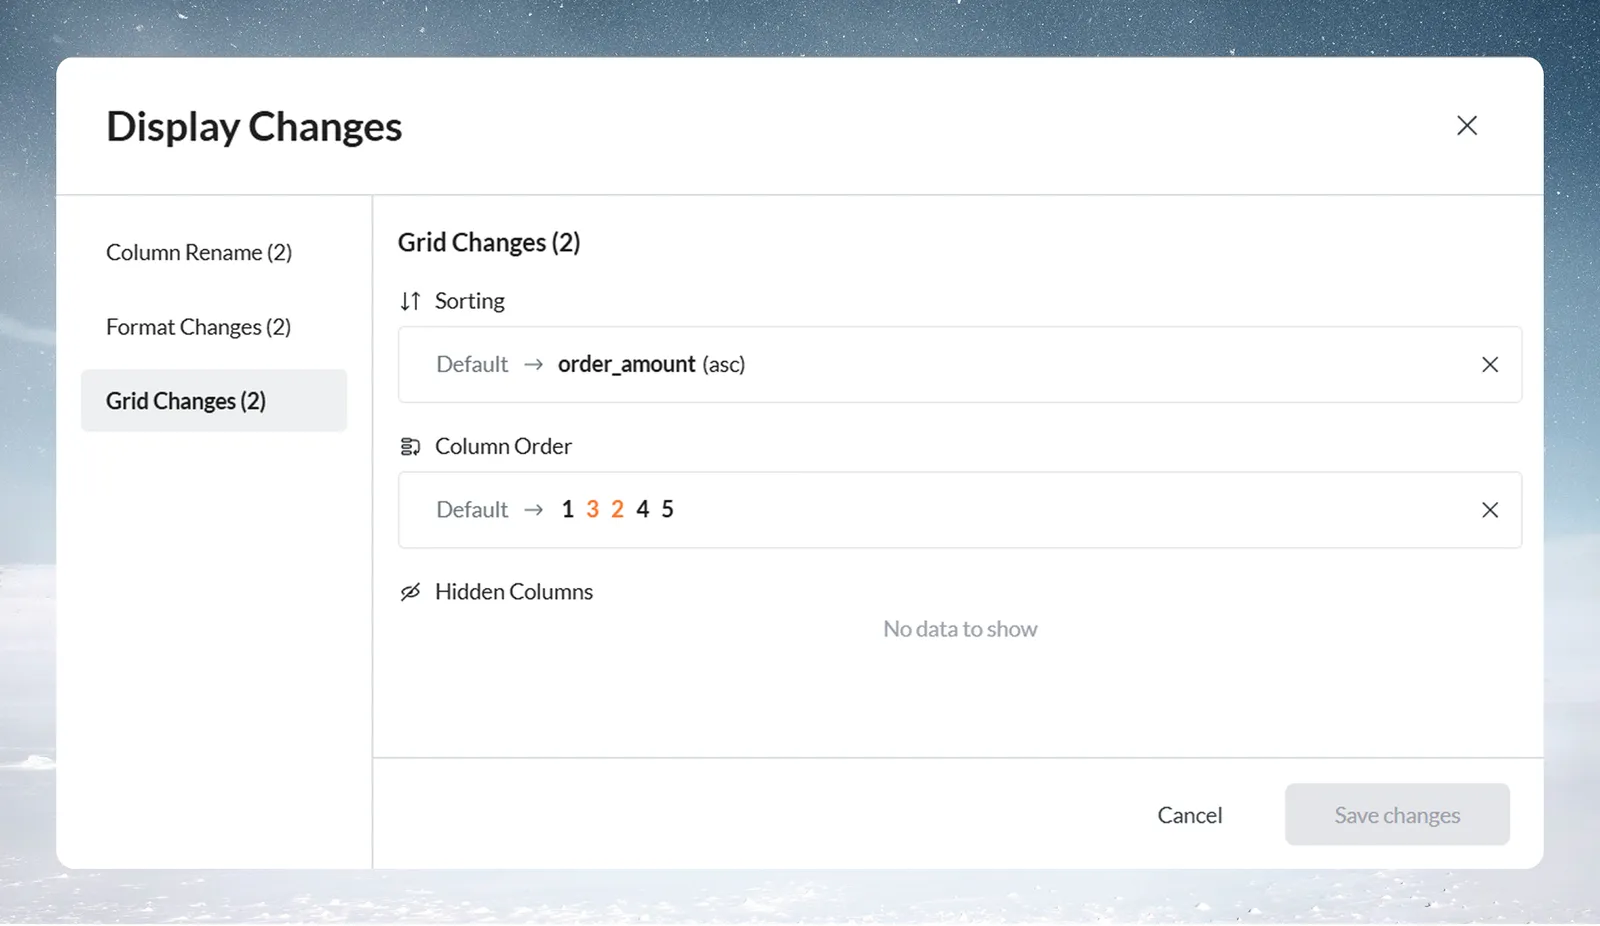
Grid Changes—shows active sorting, column order, and hidden columns. Each has an X to revert individually.
Each section also has an Undo changes button. The submit button reads Save changes and is disabled until you make a modification within the modal (such as clicking X to revert something); after that it reads Apply n changes.
Key characteristics of Display Changes
- View-specific—each View has its own Display Changes. A new View starts with none.
- Apply immediately in most cases. Format changes require clicking Apply in the formatting panel.
- Do not create pipeline tasks—the Pipeline panel is unaffected.
- Renamed columns appear with their new names in the data grid, pipeline task dropdowns, and exports.
- Not part of automation—Display Changes are presentation only and do not run as part of scheduled pipelines.
Pipeline Tasks
Pipeline Tasks transform the actual data. They are the operations you add through the Transform menu and they make up your pipeline. All 30+ transformation functions, plus Data Check and Checkpoint, are pipeline tasks.
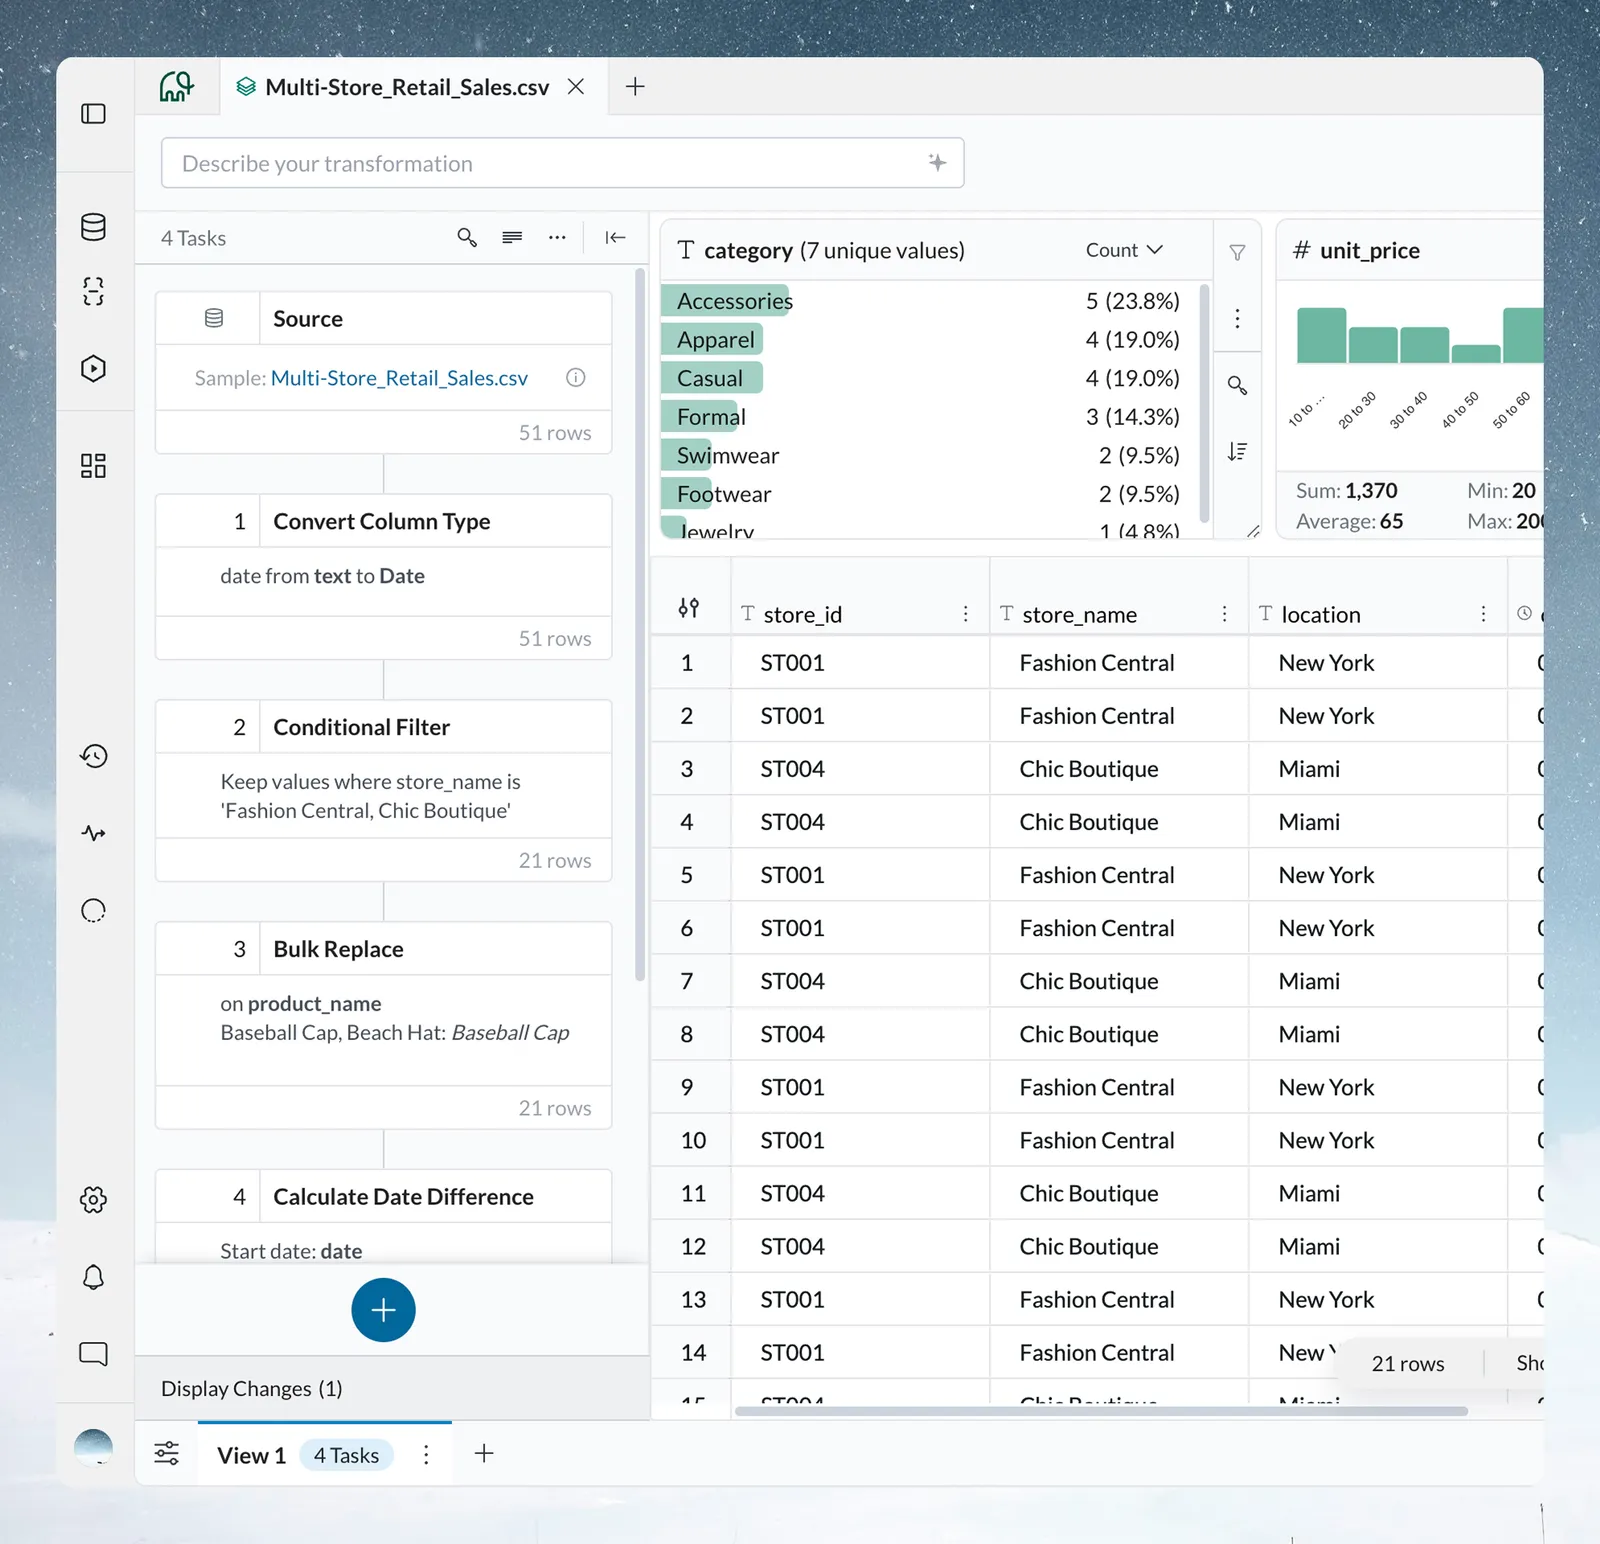
Key characteristics of Pipeline Tasks
- Run automatically every time new data flows through the View.
- Apply to all data, not just what is currently visible.
- Execute in the order they appear in the Pipeline panel, top to bottom.
- Are part of automation—when you schedule a pipeline, these tasks run.
- Maintain a complete history in the Activity Log.