What is Mammoth Analytics?
Mammoth Analytics is a no-code data preparation and AI-powered dashboard creation platform that enables business users to automate data workflows. It makes data operations accessible to business analysts, operations managers, and domain experts without requiring IT support or extensive technical training.
The data preparation problem Mammoth addresses
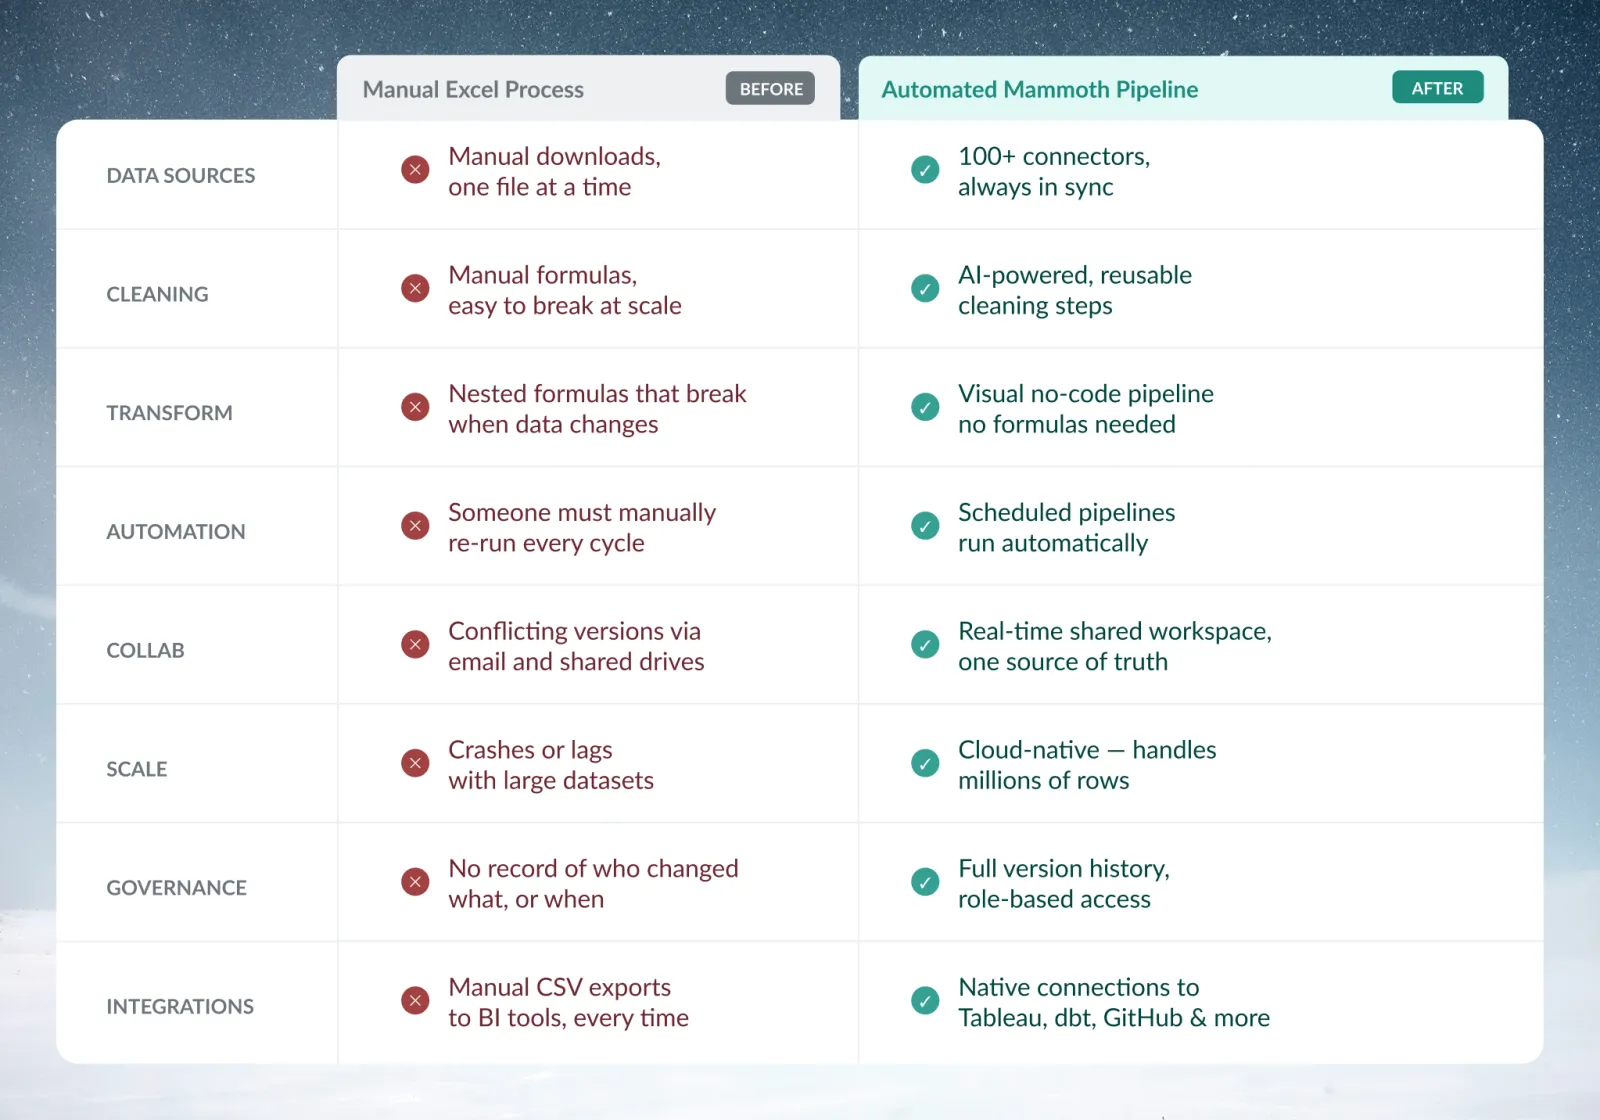
Business teams often spend more time preparing data than analyzing it, for these reasons:
- Spreadsheets have row limits and don't automate recurring work
- Traditional data preparation tools require technical training
- BI tools require clean data input
- IT teams become bottlenecks for simple data requests
The result is manual processes, back-and-forth between business teams and IT, and a steep learning curve.
How Mammoth works
Mammoth is built on three principles:
Accessibility over complexity
Mammoth has an Excel-familiar interface with drag-and-drop operations. Visual pipeline development requires no coding.
End-to-end data journey
Mammoth covers the whole data workflow:
Connect: Access connectors including files, databases, APIs, and cloud applications through Live Connections
Explore: Interact with automatically generated Explore Cards for column-level filtering and quick data exploration
Assess: Use View Data Quality and View Insights to profile datasets, detect issues, and understand patterns
Transform: Visual transformation functions plus AI-powered capabilities let you clean, combine, and reshape data without coding
Analyze: Built-in metrics and calculations
Share: AI-powered dashboards, flexible exports, and Live Links deliver insights to stakeholders
To build your first automated pipeline, follow the Quick start.
Cloud-based infrastructure and certifications
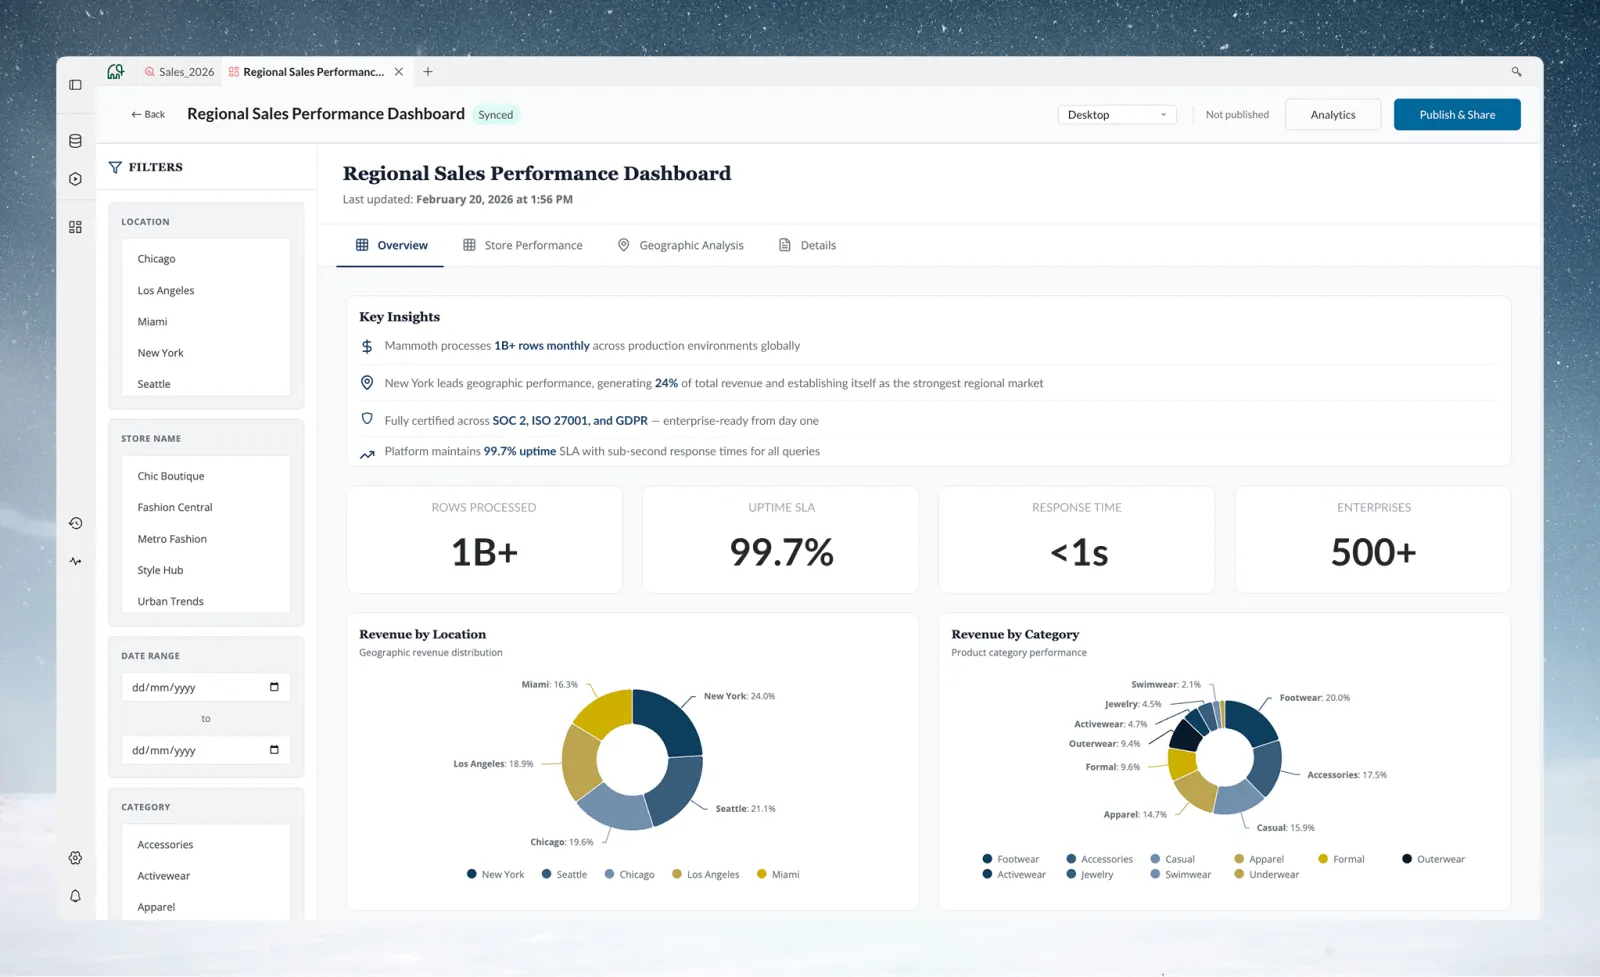
Mammoth runs on cloud-based infrastructure, so there are no local hardware limits. The platform is SOC 2 Type II and ISO 27001 certified.
Who Mammoth is for
Business analysts
Excel power users hitting scalability limits who need to automate recurring monthly or weekly reports. Mammoth turns manual work into automated pipelines, for example when consolidating multi-source reports.
Technical enablers
IT and analytics teams supporting business users who are overwhelmed by simple data requests. Data engineers use Mammoth to enable self-service analytics across the organization.
Operations managers
Leaders who need visibility into data processes and want their teams to be self-sufficient. Mammoth provides audit trails and governance while enabling team independence. Operations leaders use it to standardize workflows across multiple teams.
Industries Mammoth is used in
Financial Services: Regulatory reporting and compliance automation with complete audit trails
Manufacturing: Production data consolidation, quality analysis, and supply chain visibility
Hospitality: Multi-location operations reporting and guest experience analytics
CPG: Retail analytics and distributor data harmonization across channels
Who Mammoth is not for
Mammoth has these limits:
Not a traditional data warehouse: Mammoth provides cloud-based data storage optimized for active transformation work, not long-term historical archiving. Many customers export transformed data to warehouses like Snowflake or Redshift for long-term analytical storage.
Not for advanced data science modeling: Our focus is data preparation and business analytics, not building ML/AI models in Python or R.
Not for real-time streaming: Mammoth optimizes for batch processing and transformation workflows, not sub-second event streaming.
Not a code-based ETL tool: If your team prefers writing Python or SQL scripts over visual interfaces, traditional ETL tools may be a better fit.
Mammoth sits between data sources and analysis as the transformation layer: business users prepare data themselves, then send it wherever needed.
Platform capabilities
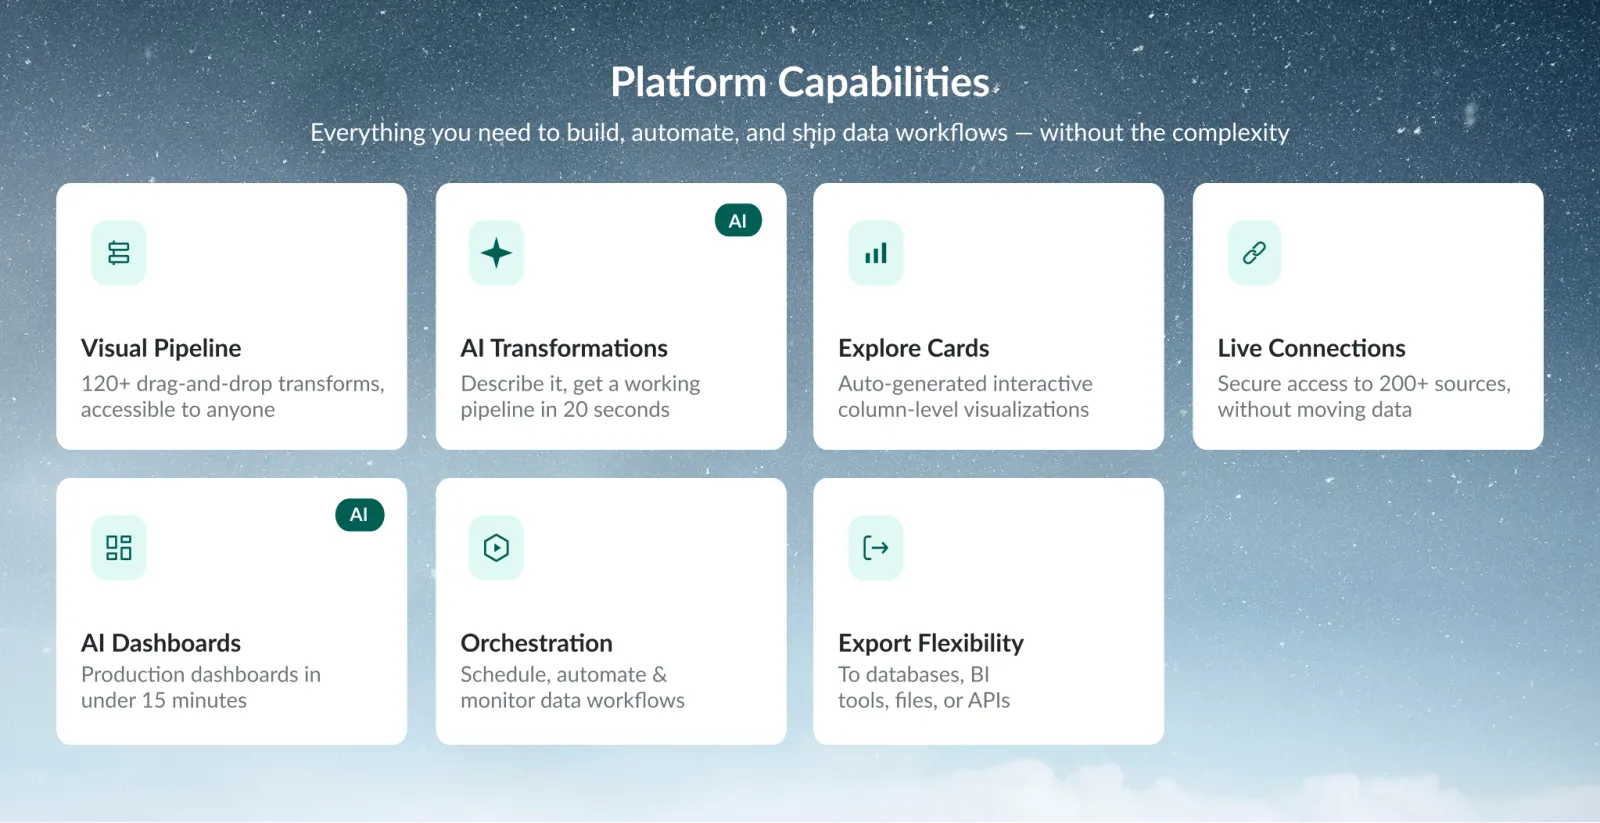
Visual pipeline development: Drag-and-drop transformation functions accessible to anyone
AI-powered transformations: Describe what you want and get a working pipeline
Explore Cards: Automatically generated, interactive column-level visualizations for quick filtering and exploration
Live Connections: Connections to databases, applications, and APIs
AI dashboards: Build dashboards by describing what you want
Automations: Schedule, automate, and monitor data workflows
Export flexibility: Send data to databases, warehouses, BI tools, files, or APIs
Security
- SOC 2 Type II certified
- ISO 27001 compliant
- SSO (SAML/OIDC) and enforced MFA, available as plan features
Getting started
To begin:
-
Try the quick start: Build your first pipeline
-
Explore by persona: Choose your role-based learning path for targeted guidance
-
Sign up for a trial: Try Mammoth with your own data
Start with one manual process you repeat monthly and automate that first.