Monitor
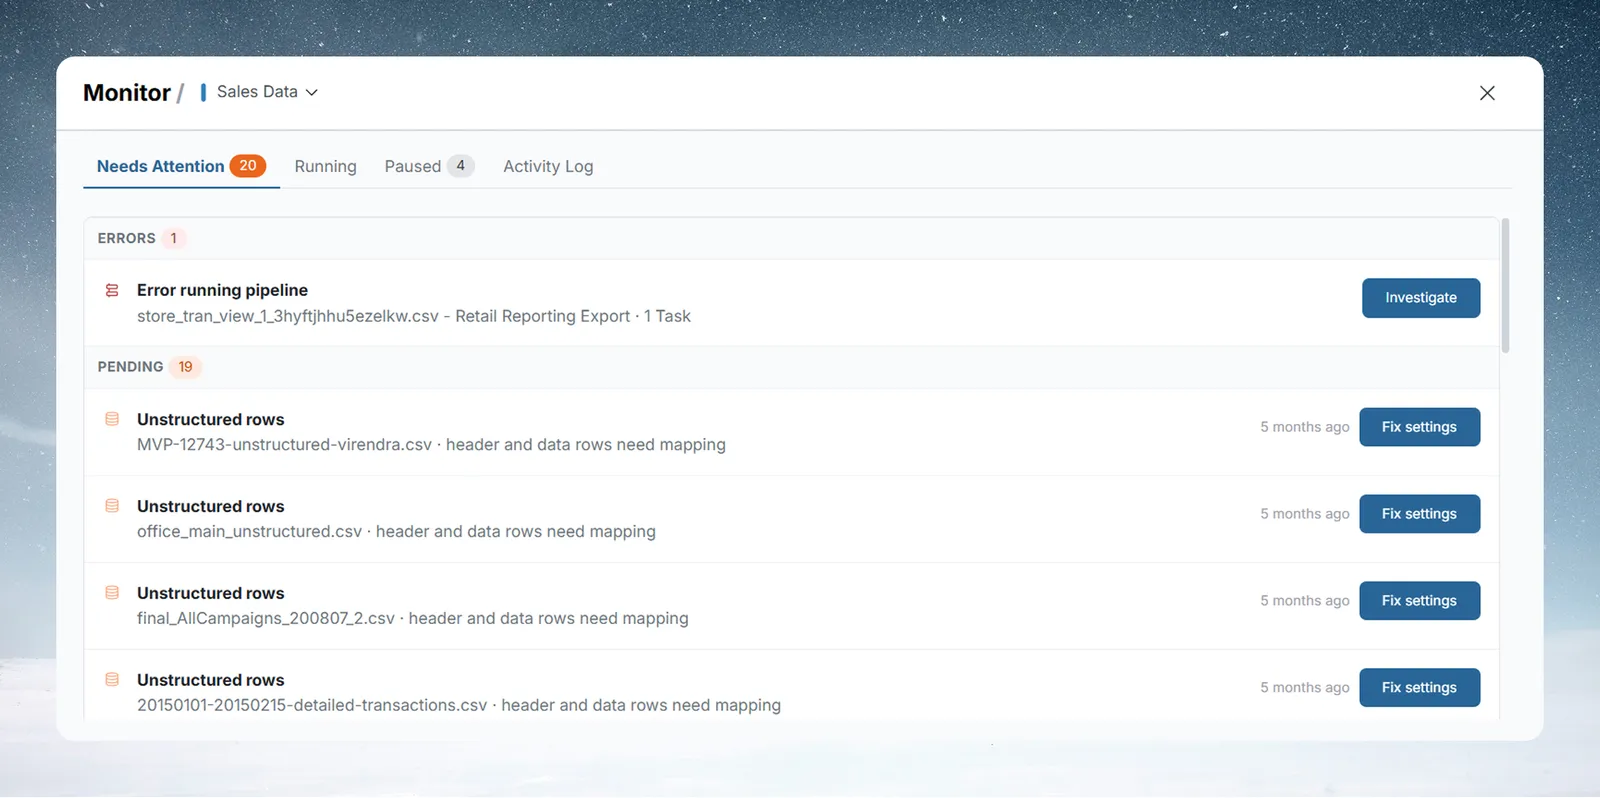
Monitor shows everything happening in a Mammoth project: items waiting for your action, pipelines and Automations currently running, items with Auto-sync paused, and an Activity Log of workspace events. This page is for analysts, operations managers, and administrators. Start with Needs attention if you saw the orange badge.
Open Monitor
Click Monitor in the left sidebar navigation. The orange badge shows the count of items in the Needs Attention tab. The badge automatically:
- Displays when one or more items need attention
- Disappears when all items are resolved (or you have no access to see any Needs Attention items)
The badge updates with each poll cycle, so you always see the current count.
Switch projects
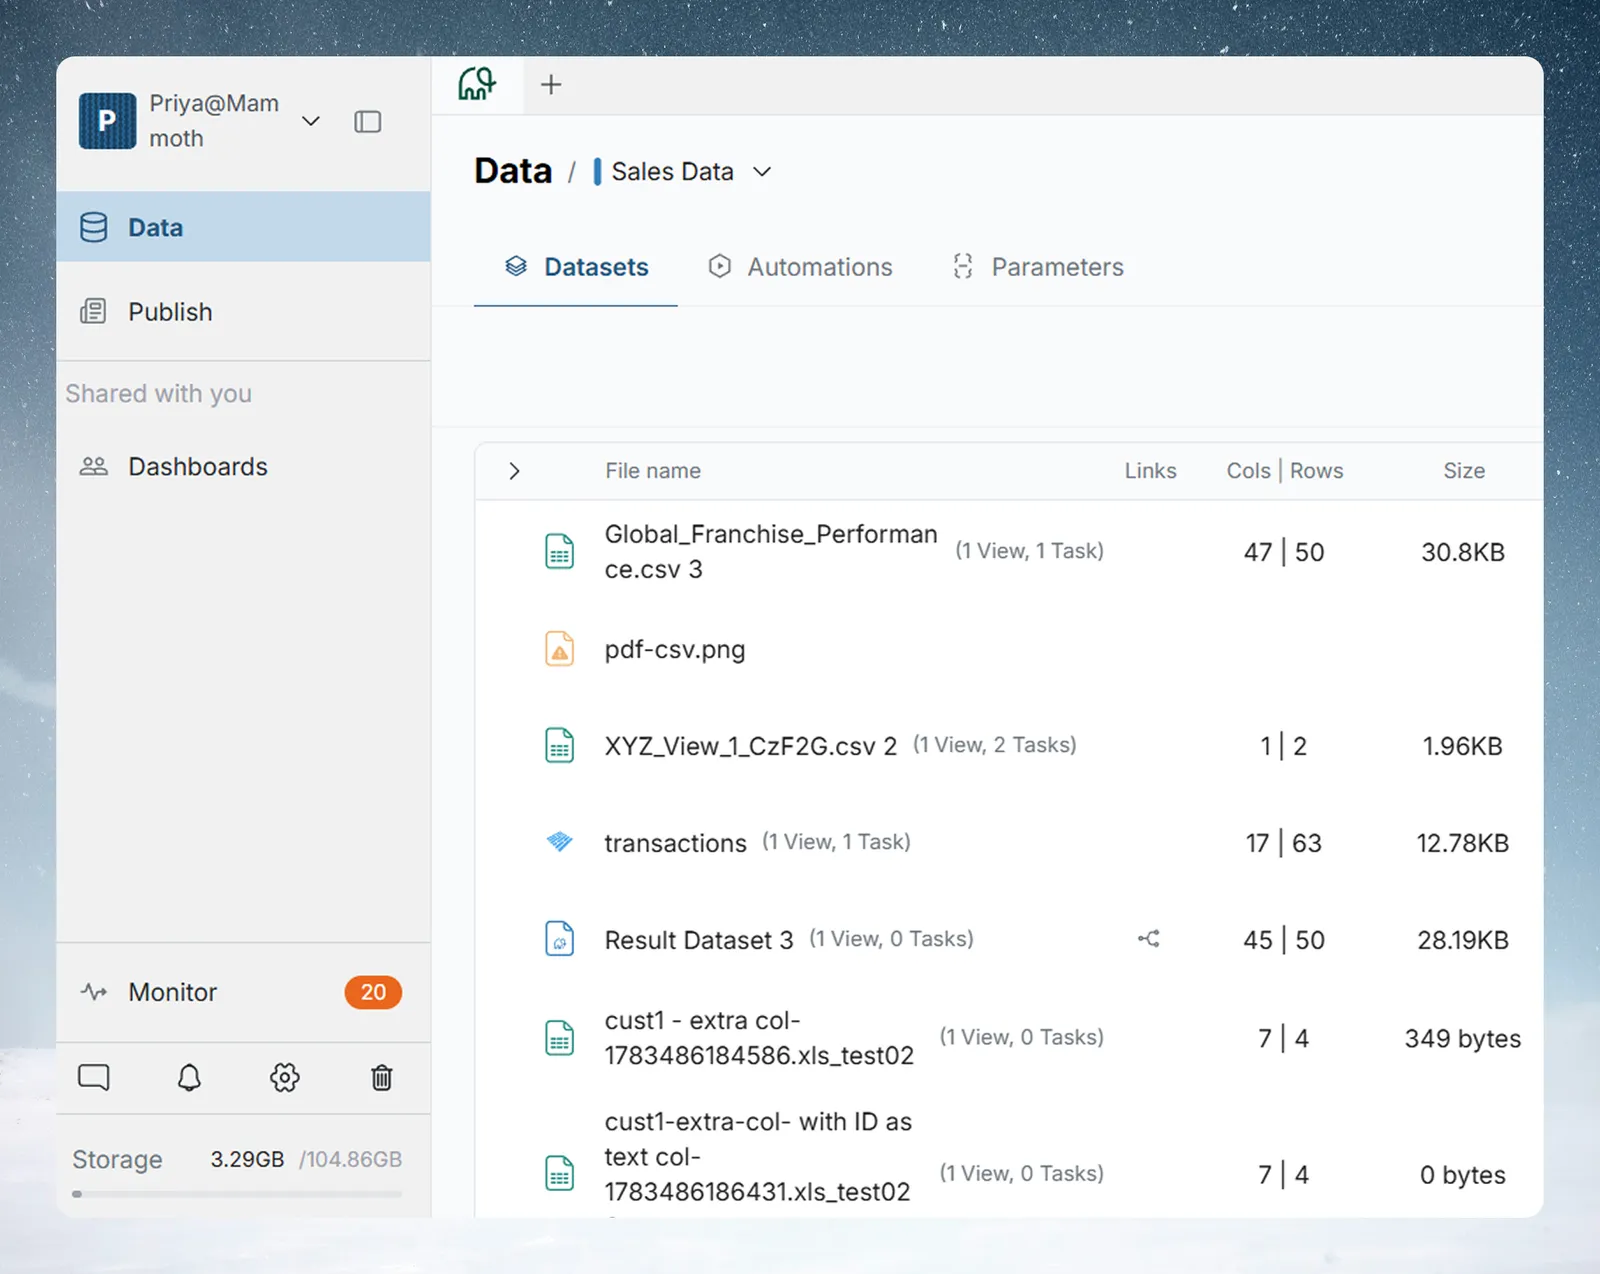
The project selector dropdown next to the Monitor title lets you view any project you have access to. Switching projects here does not change which project you are working in. It is a read-only view into that project's live state.
Monitor tabs
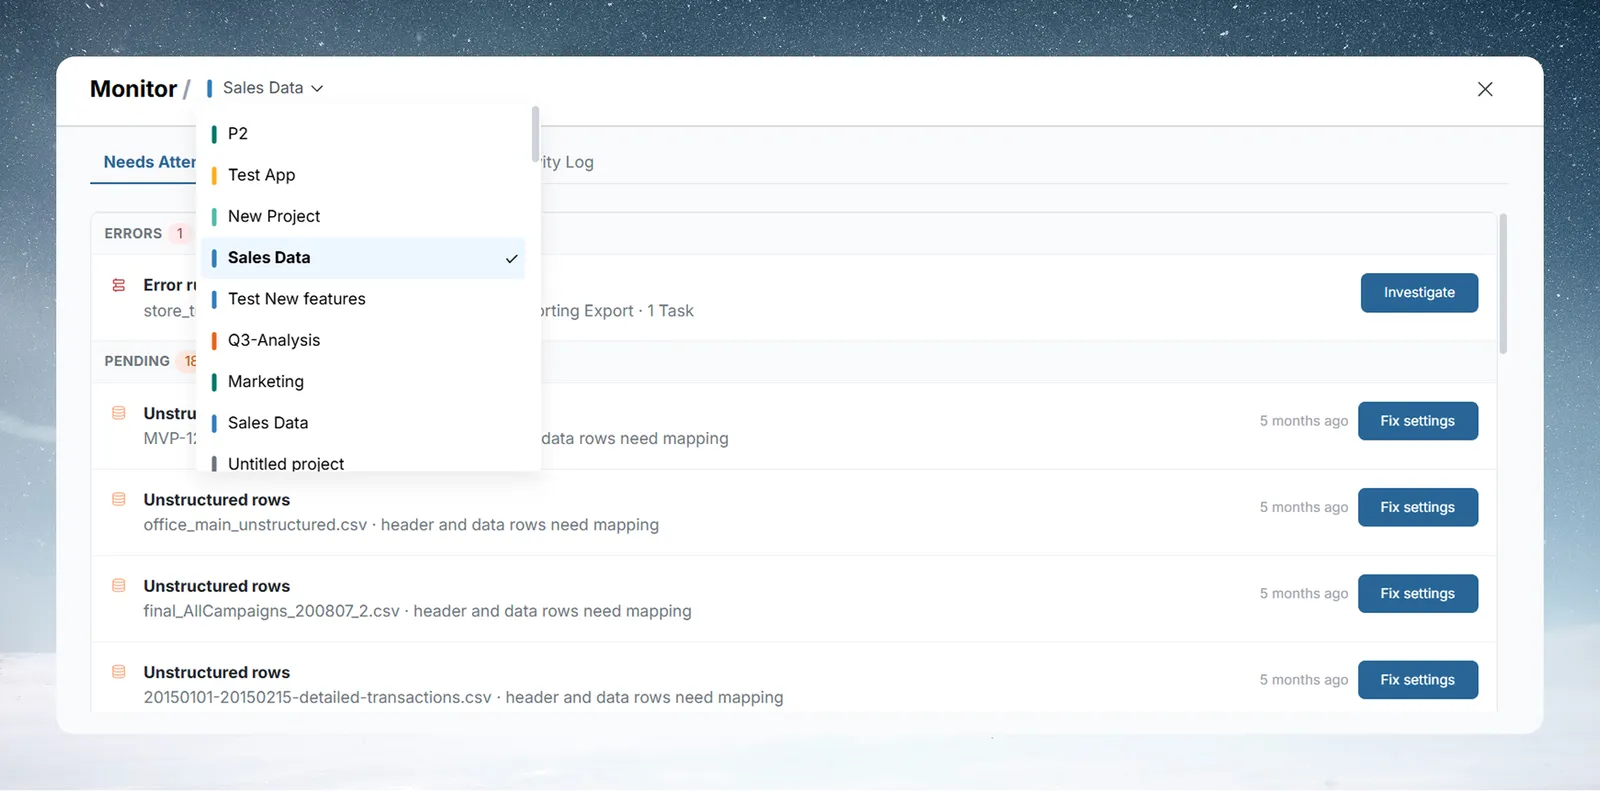
| Tab | Badge color | What it shows |
|---|---|---|
| Needs Attention | Orange | Items requiring your action: errors, pending data, pipeline drafts, governance |
| Running | Green | Pipelines, tasks, and Automations currently executing or queued, plus Active Retentions. The count includes Active Retentions |
| Paused | Gray | Pipeline tasks, exports, and connections with Auto-sync disabled |
| Activity Log | None | Chronological event history for the project or workspace |
All tabs refresh automatically every 5 seconds. A tab's badge count updates with each poll. The badge color is a secondary cue; each tab also shows its name and count.
Needs attention
What it shows: Everything in the project that requires your action before work can continue.
The tab is divided into up to four sections: Errors, Pending, Pending Retentions, and Governance. Each section only appears when it has items.
Empty state: Checkmark icon · "All clear" · "Nothing needs attention right now."
Errors
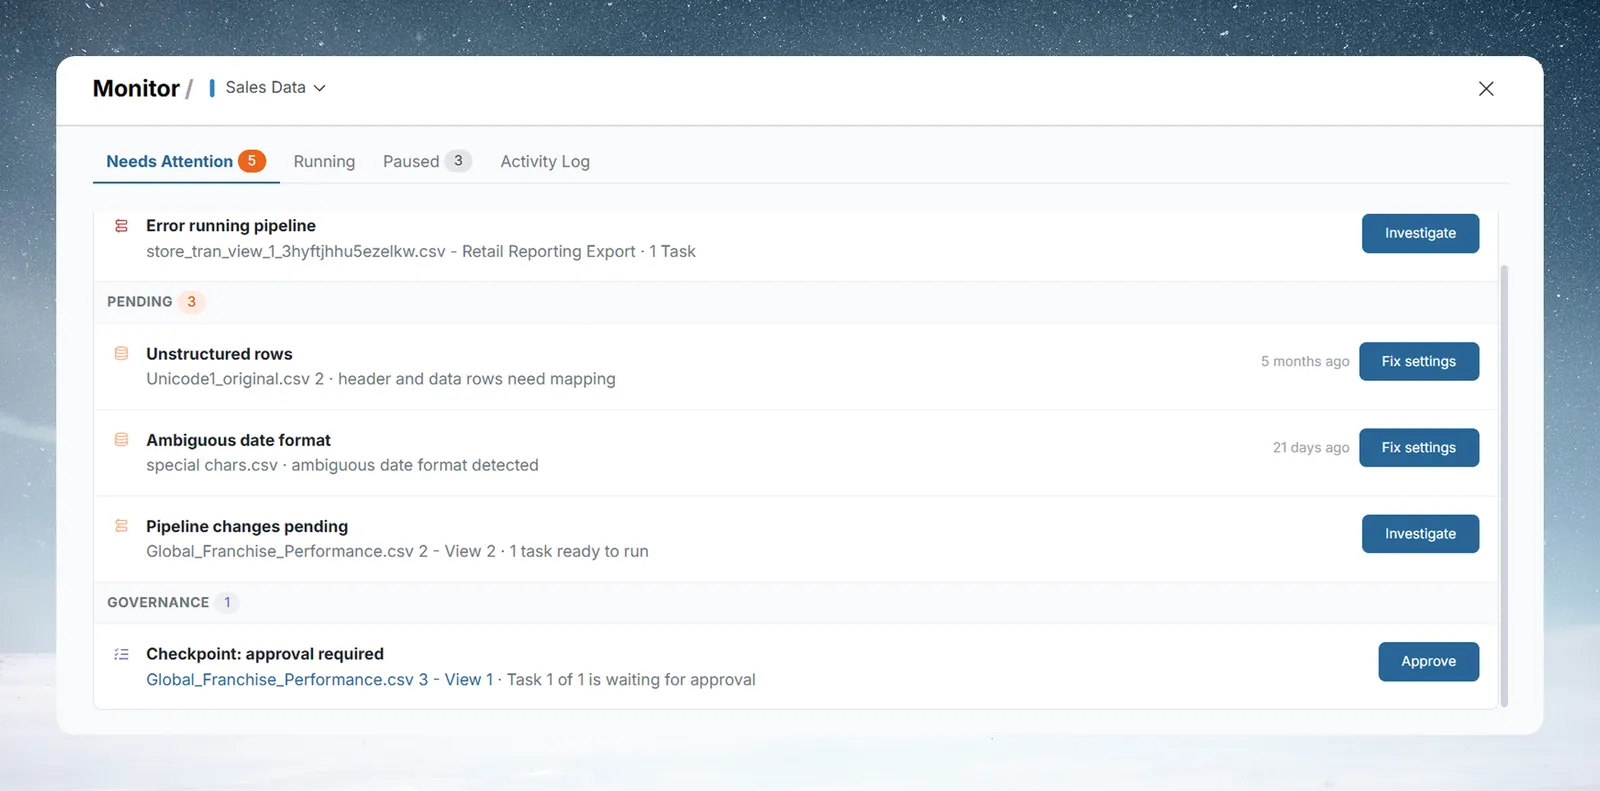
Pipeline runs that have failed.
Each row shows:
- "Error running pipeline"
- Dataset name · view name · task count
Action: Go to View opens the view in the Data Editor to inspect the error. A Show in workflow icon button opens the item in Workflows. If the view was deleted, Monitor shows "View is missing or was deleted."
Pending
Items that have arrived or changed and are waiting for you to process them.
Batch pending: New data has arrived at a destination and is waiting to be applied.
Each row shows:
- "Batch pending"
- Source view name · "New batch received {time ago}" · row count
- Destination or operation context (for example,
Join: DestinationNameorSource: dataset name)
Actions:
- View Batch: preview the incoming data before committing (appears when the destination is a dataset)
- Update: apply the batch immediately (shows a loading spinner while running; row disappears once complete)
- Copy link to clipboard: icon button that appears only for Live Link destinations; copies the live link URL to clipboard so you can share it with external users
What causes a Batch pending item to appear:
- A Join or Lookup source view receives new batch data
- A connector export or Publish-as-Database destination receives new data
- A cross-project dependency's upstream source is updated
- A Live Link's external source changes
When the source link has Auto-sync off, the incoming batch is held. The row reads "new batch received, auto-sync off" and shows Preview and Process instead of View Batch and Update.
Items clear automatically when the destination is updated or when auto-sync is re-enabled.
Other pending items that need your input appear in the same section: Ambiguous date format, Password required (a password-protected file), Schema mismatch, Sheet selection required, and Unstructured rows. Each row has a button such as Select sheets, Fix batch settings, or Fix settings that takes you to the item.
Update pending: A destination that isn't a dataset (for example, an export) has new source data available.
Each row shows:
- "Update pending"
- View name · row count · export type (for example, 66,943 rows · Export: MySQL)
Actions: Update triggers the update immediately. The row can also show Copy link to clipboard for a Live Link. After a successful update, a toast reads "Update data".
Pipeline changes pending: A pipeline has draft changes that have not yet been applied.
Each row shows:
- "Pipeline changes pending"
- Dataset - view name · task count (for example, 6 tasks ready to run or 10 tasks ready to run)
Pipelines with errors surface at the top of this list.
Action: Go to View opens the pipeline in the Data Editor to review or apply changes.
Note: If an update fails for some items, a toast appears: "Some of the pending items could not be updated. Please verify them."
Pending Retentions
Data retention policies that are waiting for approval. The section shows the notice "These actions will permanently delete or suspend data once approved. Review each policy carefully before approving." Use Review and Approve to inspect and approve each policy. Rows are labeled "pending deletion" or "pending suspension".
Governance
Appears when pipelines are paused at approval gates or data quality checks have failed.
| Item | Row detail | Action |
|---|---|---|
| Checkpoint: approval required | Dataset · pipeline name · "Task {X} of {Y} is waiting for approval" | Approve |
| Data check failed | Dataset · pipeline name · "{X} of {Y} checks failed" | Review |
Governance items count toward the Needs Attention badge total. Checkpoints and data checks are configured as tasks in the Visual Pipeline Builder.
Running
What it shows: All pipeline views, export tasks, and Automations currently executing or queued.
Empty state: Checkmark icon · "Nothing running" · "No tasks are processing right now." The empty state appears only when there are no running rows and no Active Retentions.
When rows are present, a status banner appears at the top:
| Banner | Meaning |
|---|---|
| Executing (green dot) | Tasks are running and progressing normally |
| Stuck (red dot) | One or more tasks have exceeded expected duration thresholds; the banner reads "All active pipeline and export tasks across the workspace appear here. Tasks that have been running for an unusually long time may be marked as stuck." |
Each row shows the item name (clickable link to open in Data Editor), a status pill, and detail text on the right. A Show in workflow icon button opens the item's workflow.
Status pills:
| Status | What it means |
|---|---|
| Queued | Waiting for a worker; will start automatically |
| Executing | Actively processing right now |
| Waiting for Worker | No worker currently available |
| Registering Lock | Acquiring a resource lock before processing |
| Waiting for Lock | Another task holds the lock; starts when released |
| Stuck | Task has likely hung—see Understanding Stuck status |
Automation detail text (shown per row as caption):
| Phase | Text shown |
|---|---|
| Collecting files | {N} file(s) collected |
| Validating | Validating {processed} / {total} files |
| Appending | Appending {N} files |
| Finalizing | Finalizing... |
Automation task type labels:
| Label | What it is |
|---|---|
| Dataset Refresh | A scheduled cloud dataset refresh |
| Data Consolidation | A file consolidation run |
| File Collection | A cloud storage file retrieval run |
| Messaging | A scheduled email send |
| Add File as Batch | Adding a file as a new data batch |
| Delete Batches | Batch cleanup operation |
| Cloud Storage Retrieval | Fetching files from cloud storage |
| Run Pipeline | Pipeline execution task |
| Tag File | File tagging during retrieval |
Active retentions
Below the task rows, an Active Retentions section lists data retention policies that are running. Each row shows the dataset name, Deleting or Suspending with the rule, and a progress bar with the number of affected batches out of the total batches. A search box filters the list by dataset name.
Understanding Stuck status
A task is flagged Stuck when Mammoth determines it is unlikely to complete on its own:
| Condition | Threshold |
|---|---|
| Waiting for Worker | > 10 minutes |
| Registering Lock | > 5 minutes |
| Executing | > 5 hours |
| All tasks Waiting for Lock with none younger than 5 minutes | Triggered immediately |
To resolve a Stuck task:
- Click the linked name to open the view in the Data Editor
- Go to the Activity Log tab and filter by category and date range
- Read the error—common causes: expired connector credentials, deleted source dataset, schema mismatch upstream
- Fix the root cause, then return to Monitor to confirm the next run clears
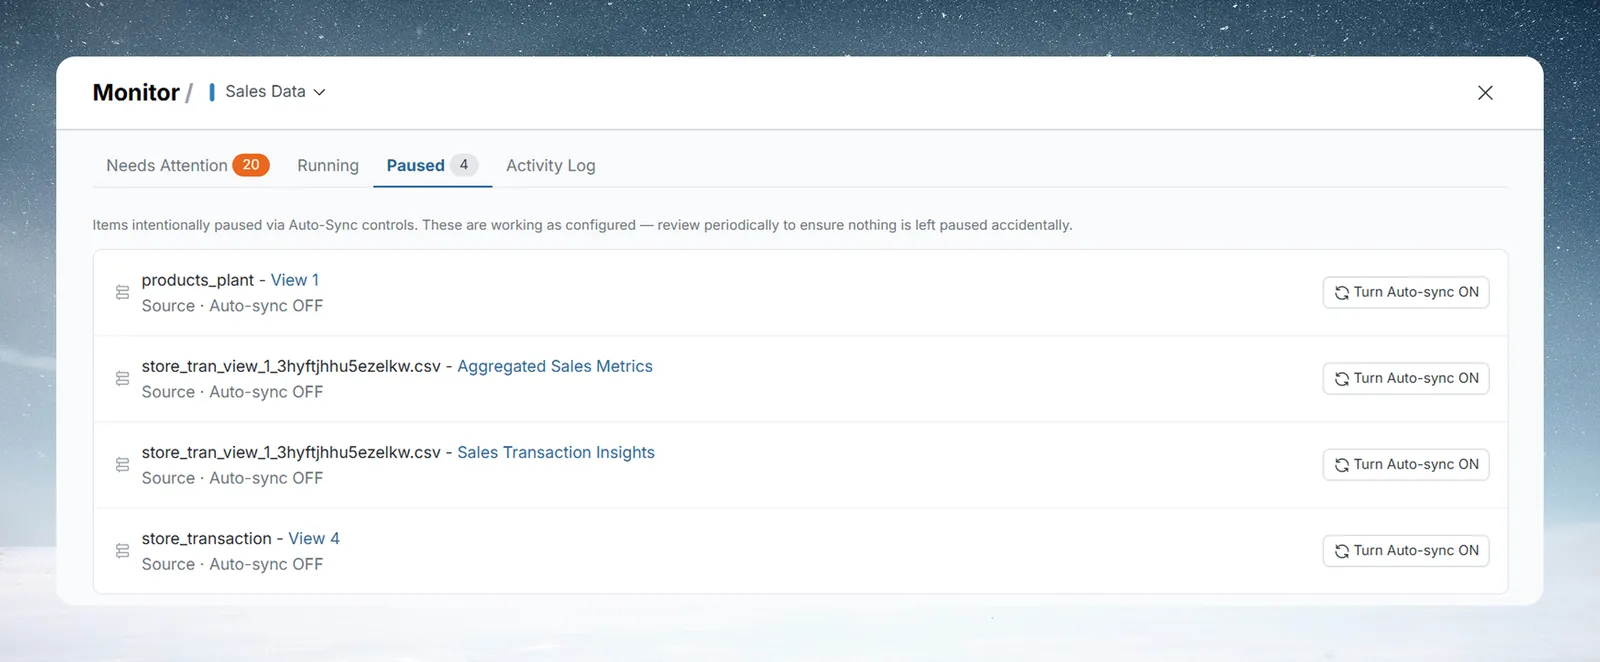
Paused
What it shows: All pipeline tasks (such as joins, lookups, crosstabs, and sends to another dataset), exports, Mammoth Managed DB publishes, and live links where Auto-sync has been turned off. When Auto-sync is off, upstream data changes do not flow through automatically, so downstream datasets may be stale.
Items intentionally paused via Auto-Sync controls. These are working as configured. Review periodically to ensure nothing is left paused accidentally.
Empty state: Checkmark icon · "Nothing paused" · "Every task is syncing automatically."
Each row shows:
- Dataset name - view name (clickable link)
- Operation type · Auto-sync OFF
- Turn Auto-sync ON button
When Turn Auto-sync ON is clicked, the button becomes disabled and the status changes to "Auto-sync on, syncing now" while the toggle is applied. The row clears once sync is active.
Operation types:
| Type | What it represents |
|---|---|
| Join | A join task |
| Lookup | A lookup task |
| Crosstab | A crosstab task |
| Send to Dataset | A task that sends data to another dataset |
| Export (connector name) | Export to an external destination (for example, Export BigQuery or Export Snowflake) |
| Mammoth Managed DB | A view published as a Mammoth Managed database |
| Live link | A published live data link |
Rows are sorted by dataset name, then view name.
Before re-enabling: Verify the upstream data is still structurally compatible—otherwise the task may error immediately.
Activity Log tab
What it shows: A chronological record of actions in your workspace, such as creating datasets, editing pipelines, changing Automations and connections, and inviting or removing users.
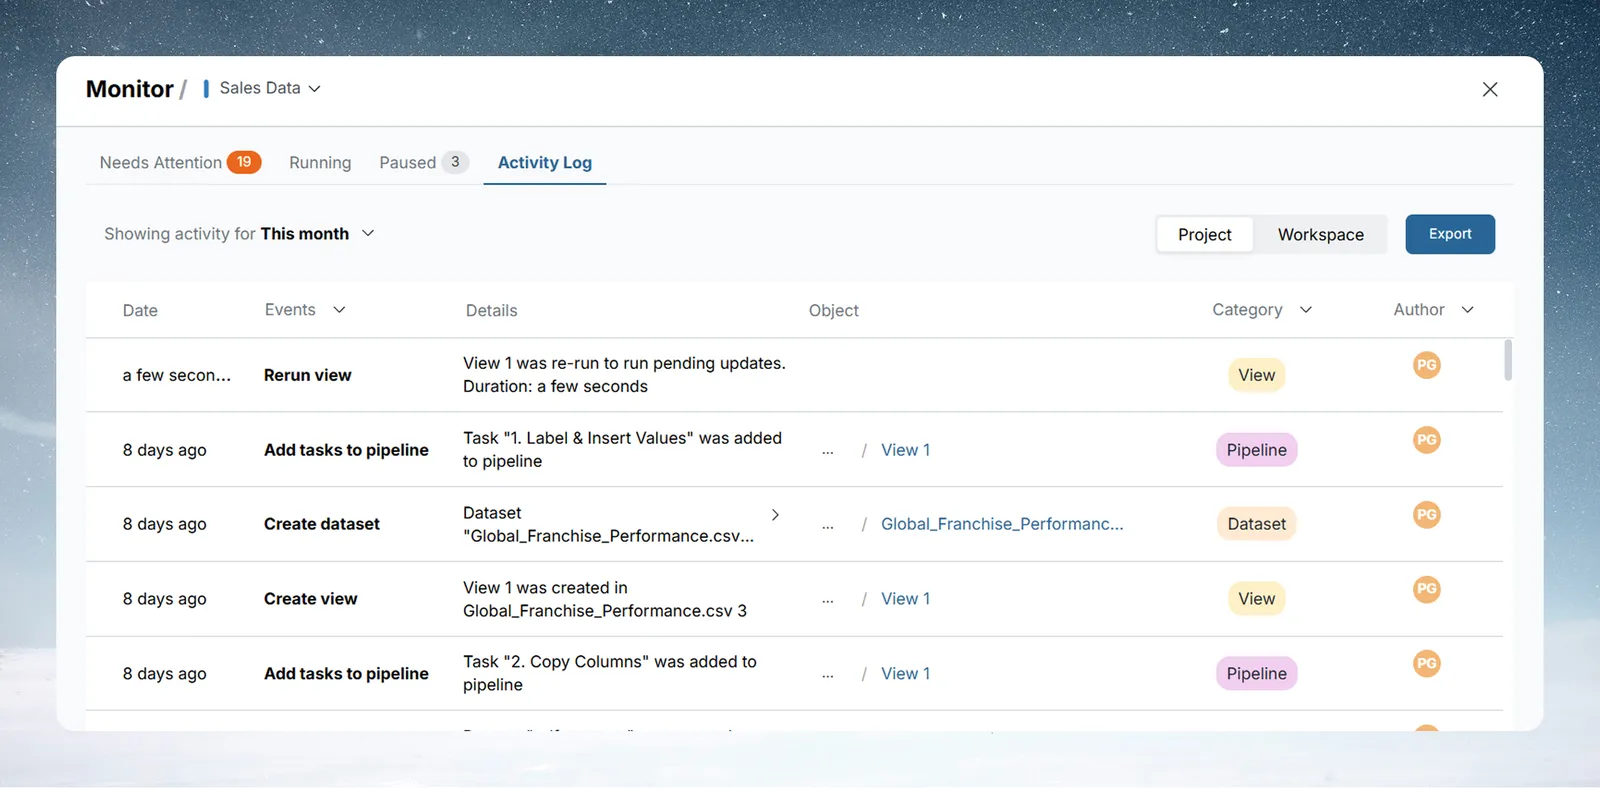
This tab requires the View Activity Log workspace permission. If you do not see it, contact your Workspace Owner.
For the full filtering, export, and compliance reference, see the Activity Log reference.
How often Monitor refreshes
Monitor polls automatically, so you never need to refresh it manually.
| State | Interval |
|---|---|
| Monitor page open | Every 5 seconds |
| Monitor page closed (modal background) | Every 45 seconds |
When you navigate away from Monitor but keep the page in the background, polling reduces to conserve resources. Polling resumes at 5-second intervals as soon as you return to the Monitor page.
Items that complete between polls disappear on the next refresh. This is expected.
Permissions
| Condition | Behavior |
|---|---|
| View-only workspace | Monitor sidebar item disabled |
| Guest / anonymous user | Monitor hidden entirely |
| Workspace not yet prepared | Monitor sidebar item disabled |
| No projects you belong to | Monitor sidebar item disabled |
| No View Activity Log permission | Activity Log tab not shown |
Troubleshooting
A pipeline I triggered isn't showing in Running
Monitor refreshes every 5 seconds. Fast pipelines may finish before the next poll.
"Some of the pending items could not be updated. Please verify them."
One or more batch updates failed. Check each item individually.
An Automation appears Stuck in Running
Click the item name to open its detail page. Common causes: expired Live Connection credentials, a deleted source dataset, or a file format change in the source folder.
A Checkpoint is not clearing after I approve it
The pipeline resumes automatically after approval. If it doesn't clear within a few minutes, open the pipeline from the Errors section or the Data Editor to check the next run.