Metrics panel
The Metrics panel calculates single-value metrics from your columns, such as total revenue, average deal size, or defect rate. Metrics update as you filter your data in Explore Cards.
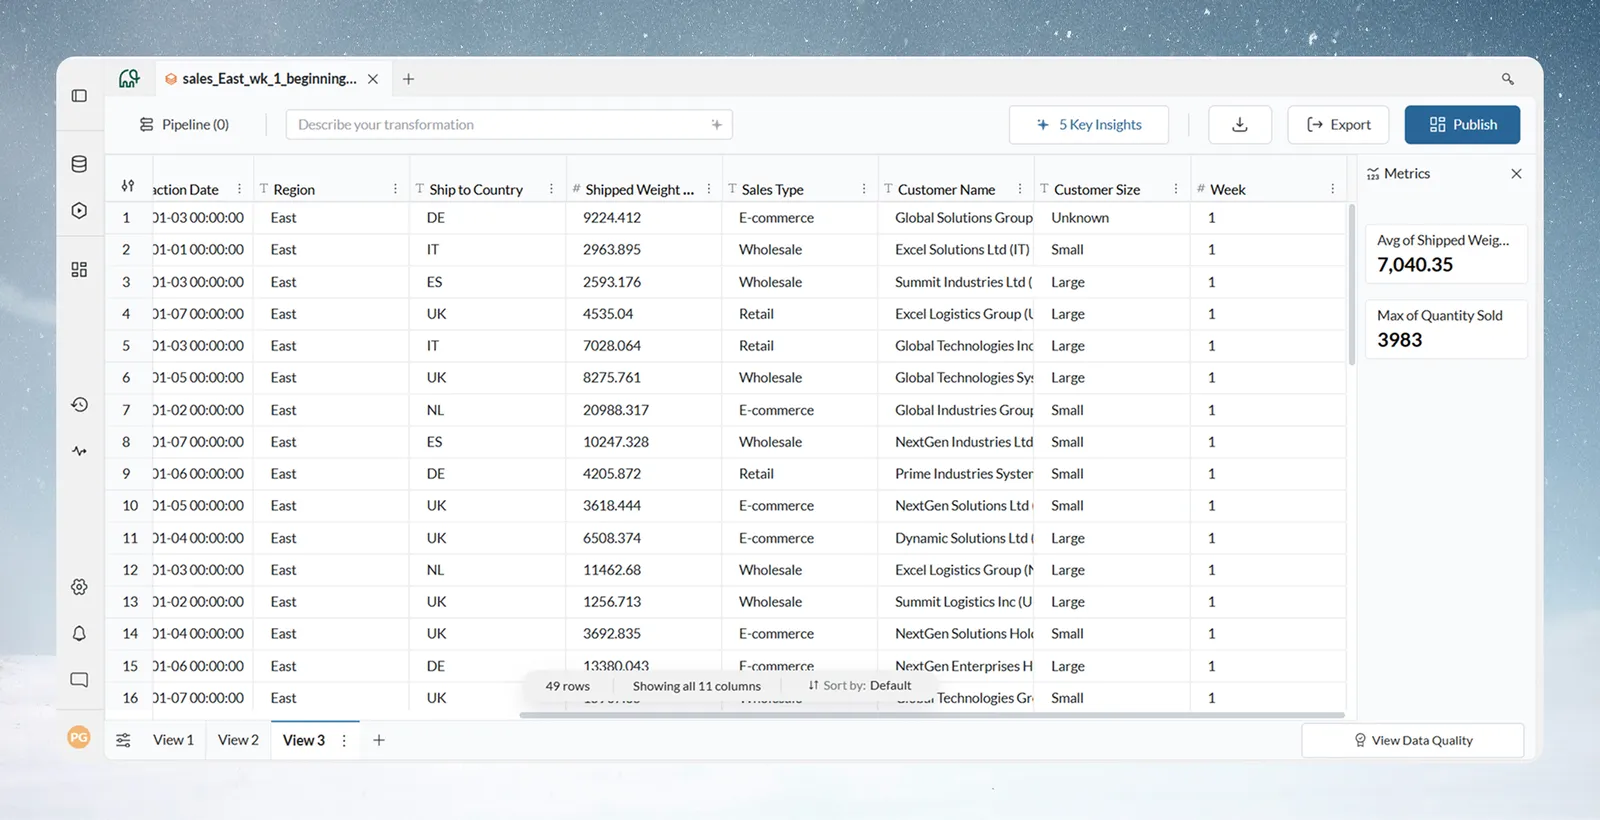
Use it for sales monitoring, quality control tracking, and financial compliance, where you need key numbers at a glance.
Create metrics
You can create a metric from a column header or from the Metrics panel.
Path 1: From the data grid column header
To create a metric for one column, start from the data grid.
- Hover a numeric column header in the data grid
- Click the Create Metric icon that appears in the column header (it appears on numeric columns only)
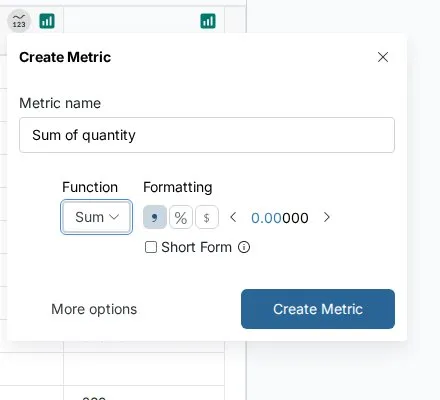
- A "Create Metric" popup appears with:
- Metric name: Auto-populated (e.g., "Sum of quantity_on_hand")—editable
- Function: Dropdown to select your aggregation (Sum, Average, Standard Deviation, Min, or Max)
- Formatting: Currency, percentage, decimal, and short form options
- Click Create Metric to add it to the panel instantly. A "Metric added" message confirms it
- Click More options instead to open the full metric editor (Title, Subtitle, Description, expression, conditions) with these settings filled in
Path 2: From the Metrics panel
There are two ways to open the Metrics panel:
- Action bar: Click the Metrics icon in the action bar at the top of the data editor, next to the Highlights icon. The icon shows an active state when the panel is open.
- Right-edge tab: Click the rotated "Metrics" tab on the right edge of the View interface. When the View has metrics, the tab shows how many.
Both open the same Metrics panel.
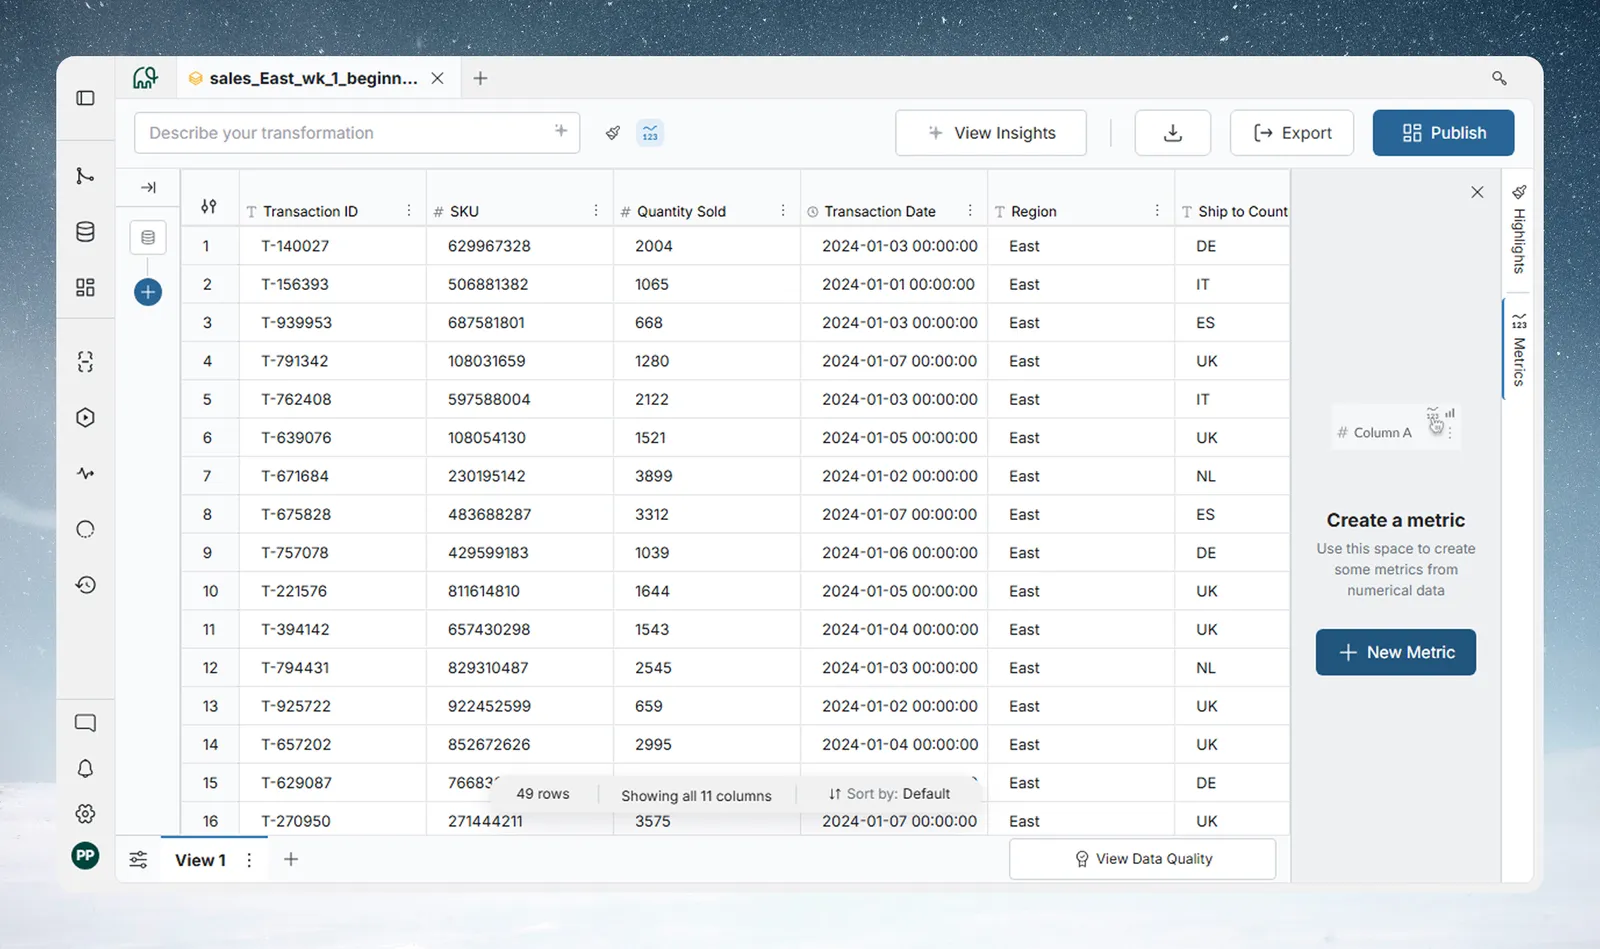
When no metrics exist, the empty state displays:
- "Create a metric" heading
- "Use this space to create some metrics from numerical data" description
- + New Metric button
Click + New Metric to open the full New Metric modal.
Metrics are unavailable in Preview mode. The panel says so, and when the View has metrics it offers Exit Preview.
New metric modal
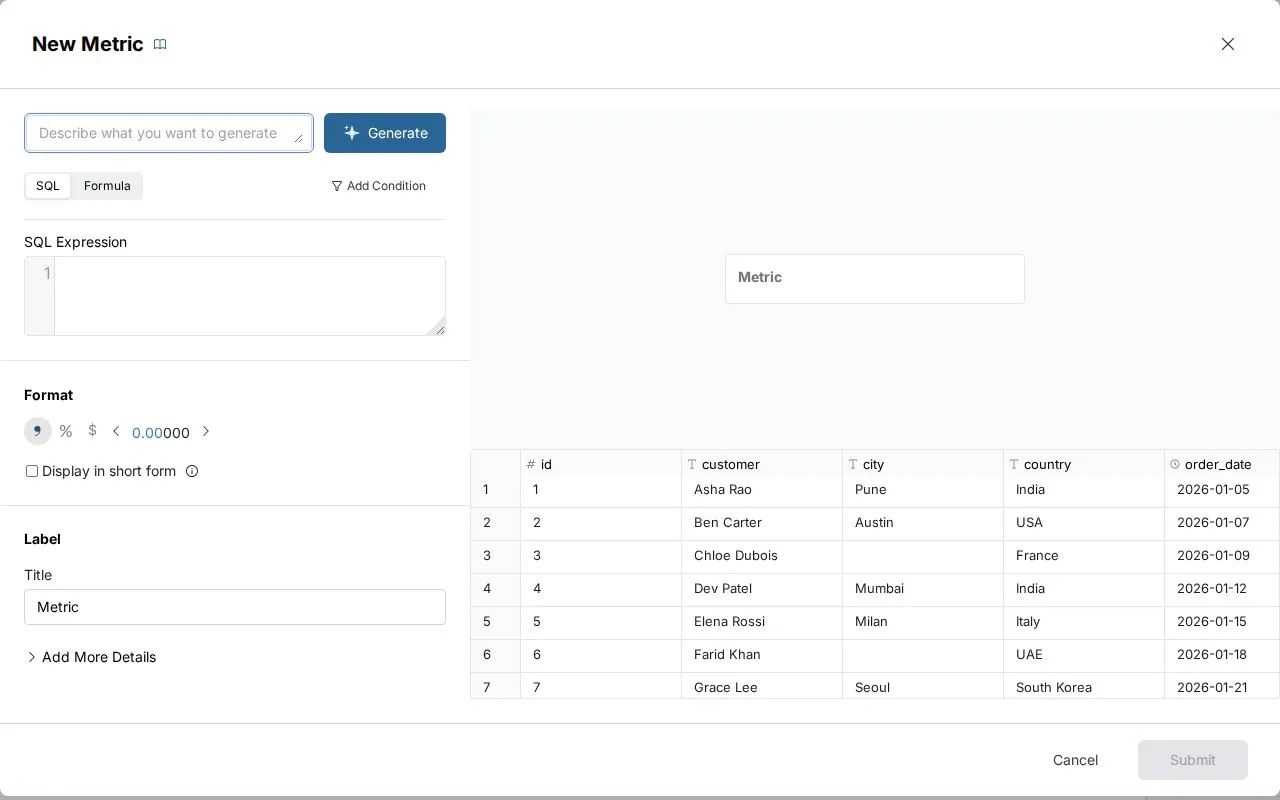
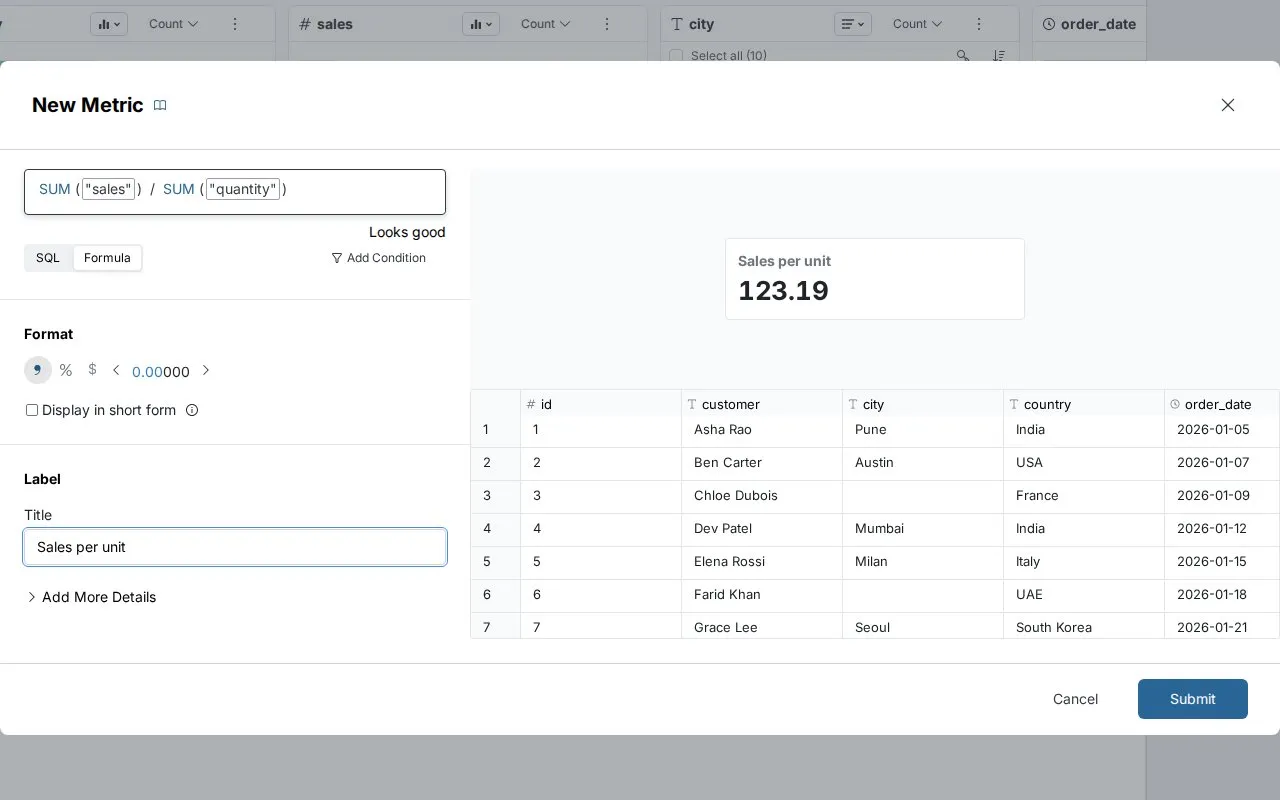
The New Metric modal opens in SQL mode by default, with an AI-powered expression generator at the top. When enabled for your workspace, a switch lets you change between SQL and Formula modes. The book icon next to the title opens this documentation.
AI Generate (default—SQL mode)
- Type a plain-English description in the box labelled "Describe what you want to generate"—for example: "Create a metric for the total quantity sold"
- Click Generate (or press Enter)—the AI writes the SQL expression for you
- Review the generated expression in the SQL Expression editor and adjust if needed
- Optionally add a condition to filter which rows the metric includes. If your description includes a filter, Mammoth can extract it into the condition
Formula mode
Click Formula (next to SQL) to build the expression manually using functions and column references. You can add a condition to filter which rows the metric includes in this mode too.
Right-side preview
The modal shows a live preview panel on the right with:
- A metric card rendering the current result
- A data grid showing the underlying dataset rows
Format section
| Option | Description |
|---|---|
| Numeric (default) | Plain number |
| Thousands separator (on by default) | Shows 1,234 instead of 1234 |
| % | Percentage |
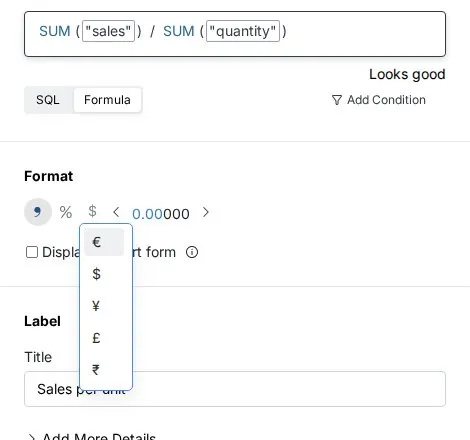
| Currency | Choose a currency symbol—USD ($), EUR (€), GBP (£), JPY (¥), or INR (₹) |
| Decimal arrows (< 0.00000 >) | Set precision up to 5 decimal places (2 by default). Disabled while short form is on |
| Display in short form | Converts large numbers: 1,234,567 → 1.23M |
Label section
| Field | Description |
|---|---|
| Title | Primary label on the metric card (required) |
| Add More Details | Expands to reveal Subtitle and Description fields |
Click Submit to add the metric to the panel. Submit stays disabled, with a tooltip saying why, until the metric has a title and a valid expression, and while the SQL is still generating. If another metric already has the title, Mammoth adds a number to it (for example "Total sales 1").
Available functions
Quick dropdown (from the column header):
- Sum, Average, Standard Deviation, Min, Max
Formula mode (full modal):
COUNT(),SUM("Column"),AVG("Column"),MIN("Column"),MAX("Column"),STDDEV("Column"),INT(expression),ABS(expression)- Combine them with
+,-,*,/, and parentheses
SQL mode (full modal):
- Describe the metric in plain words and review the generated SQL expression. You can also edit the expression directly.
Note: Column names in formulas must be wrapped in double quotes—for example,
SUM("deal_value")notSUM(deal_value).
Formula syntax examples
In Formula mode, formulas use double-quoted column names. The formula editor shows "Looks good" when the syntax is valid.
Net revenue calculation:
SUM("gross_amount") - SUM("discount") - SUM("tax")
Performance against target:
(SUM("actual_quantity") / SUM("target_quantity")) * 100
Shows percentage achievement—format as percentage for display as 87.5%.
Conditional aggregation:
SUM("amount")
Add a condition such as status is Completed so the metric includes only completed transactions.
Multi-condition count:
COUNT()
Add conditions for priority is High and status is Open to count only records that are both high priority and currently open.
For calculations that need different conditions in one expression, such as a defect rate, use SQL mode and describe the metric in plain words.
Metric card fields
When creating or editing a metric via the full modal, three text fields are available:
- Title: The primary label displayed on the metric card (required). It starts as "Metric" in the New Metric modal, and as "Sum of quantity_on_hand"-style text when you start from a column header. Fully editable.
- Subtitle: Optional secondary label shown below the value—useful for adding context such as "Q4 2024" or "West Region only."
- Description: Optional longer text, shown in smaller grey text under the value on the metric card. Hover the card text to read it in full.
Metric card actions
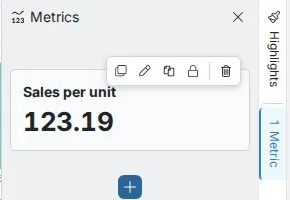
A metric card shows its title (with a lock icon when locked), the value, the Subtitle, and the Description. A metric built from a plain-English description also shows that description in a row you can click to see the generated query, and a metric with a condition shows it as a filter summary. If a metric cannot be calculated, the card shows Error; hover it to see the reason.
Hover a card to show its toolbar of five action icons (they are disabled while the pipeline has an error):
| Icon | Action | Behavior |
|---|---|---|
| Copy to clipboard | Copies the metric's title and current value | Instant—no modal. For example, Total sales: 5.2M |
| Edit (pencil) | Opens the full metric editor | Same modal as New Metric—expression, Title, Subtitle, Description, and formatting all editable |
| Duplicate | Creates a copy of the metric | Opens the "Duplicate metric" modal pre-populated with the original expression. Mammoth adds a number to the title (e.g., "Weight per unit sold 1"). Edit before submitting or accept as-is. |
| Lock | Freezes the metric against explore filters | The metric keeps the filters that were active when you locked it, and does not change when you change explore filters. Click the icon again to unlock it. |
| Delete (trash) | Removes the metric from the panel | Asks you to confirm before it deletes the metric |
To add another metric once the panel already has cards, use the blue + button at the bottom of the Metrics Panel. When you have multiple metric cards, drag a card by its header to reorder it within the panel.
Format your metrics
Currency
Options: numeric (default), % (percentage), or currency—with a choice of USD ($), EUR (€), GBP (£), JPY (¥), or INR (₹). Controlled via the formatting toggle buttons in the creation popup and full modal.
Decimal control
Use the arrow controls next to the decimal display (< 0.00000 >) to set precision from 0 to 5 decimal places.
Short form display
Check "Display in short form" to convert large numbers to K, M, B format:
- 1,234,567 → 1.23M
- 45,600 → 45.6K
Tip: Use currency for revenue metrics, percentage for rates and ratios, and short form for large volume counts. Match formatting to how your stakeholders expect to see the numbers.
Dynamic updates with filters
Metrics recalculate when you filter data through Explore Cards, giving you segmented analysis.
How dynamic updates work
Initial state (all data):
- Total Revenue: $5.2M
- Average Deal: $12,340
- Order Count: 421
- Win Rate: 67%
After filtering (double-click "West" in the Region Explore Card):
- Total Revenue: $1.8M (West region only)
- Average Deal: $14,560 (West deals are larger)
- Order Count: 124 (West order volume)
- Win Rate: 72% (West team performing better)
Lock feature for comparisons
Use the lock icon on a metric card to keep its value fixed while other metrics update with filters. Lock it while no filters are applied to keep the all-data value.
Example workflow:
- Lock "Total Revenue" at $5.2M
- Filter by Region = West
- Create a new Revenue metric (unlocked)—shows $1.8M
- Compare: $5.2M (Total) vs $1.8M (West) = West represents 35% of total revenue
Real-world use cases
Sales performance dashboard
Scenario: sales manager tracking daily team performance
Metrics created:
- Daily Revenue:
SUM("deal_value") - Average Deal:
AVG("deal_value") - Deals Closed:
COUNT()with the conditionstatusisWon - Win Rate: SQL mode, described in plain words
Dynamic analysis: filter by "Q4 2024" to see fourth-quarter performance. All metrics update, revealing Q4 average deal size is 23% higher than the annual average.
Manufacturing quality control
Scenario: quality assurance monitoring production line efficiency
Metrics created:
- Units Produced:
COUNT() - Defects Found:
COUNT()with the conditiondefect_severityis notNone - Defect Rate: SQL mode, described in plain words
- Average Yield:
AVG("yield_percentage")
Insight discovery: filter by "Night Shift" reveals 4.2% defect rate vs 2.1% overall average, triggering investigation into night shift procedures.
Financial compliance monitoring
Scenario: compliance analyst tracking high-value transactions for regulatory reporting
Metrics created:
- Total Transactions:
COUNT() - High-Value Count:
COUNT()with the conditionamount> 10000 - Reportable Amount:
SUM("amount")with the conditionamount> 10000 - Compliance Rate: SQL mode, described in plain words
Metrics panel vs other features
Metrics panel versus Explore Cards
| Feature | Metrics panel | Explore Cards |
|---|---|---|
| Purpose | Single-value KPIs | Data distributions |
| Creation | User-defined calculations | Added by you for any column |
| Display | Large numbers with labels | Charts and ranked lists |
| Use Case | Monitoring totals, averages | Pattern discovery, filtering |
Use Explore Cards to discover patterns, then create Metrics to track key numbers from those discoveries.
Metrics panel versus View Insights
| Feature | Metrics panel | View Insights |
|---|---|---|
| Source | Manual metric creation | AI-generated observations |
| Control | Full user control | AI determines insights |
| Persistence | Saved with View | Generated on demand, then saved until the View's data changes |
| Focus | KPI monitoring | Business intelligence |
Tip: Create 3-5 core metrics for any dataset: total count, key sum (revenue or quantity), main average, and 1-2 business-specific ratios. These cover the basics of any dataset.
Advanced metric patterns
Segment comparison using lock
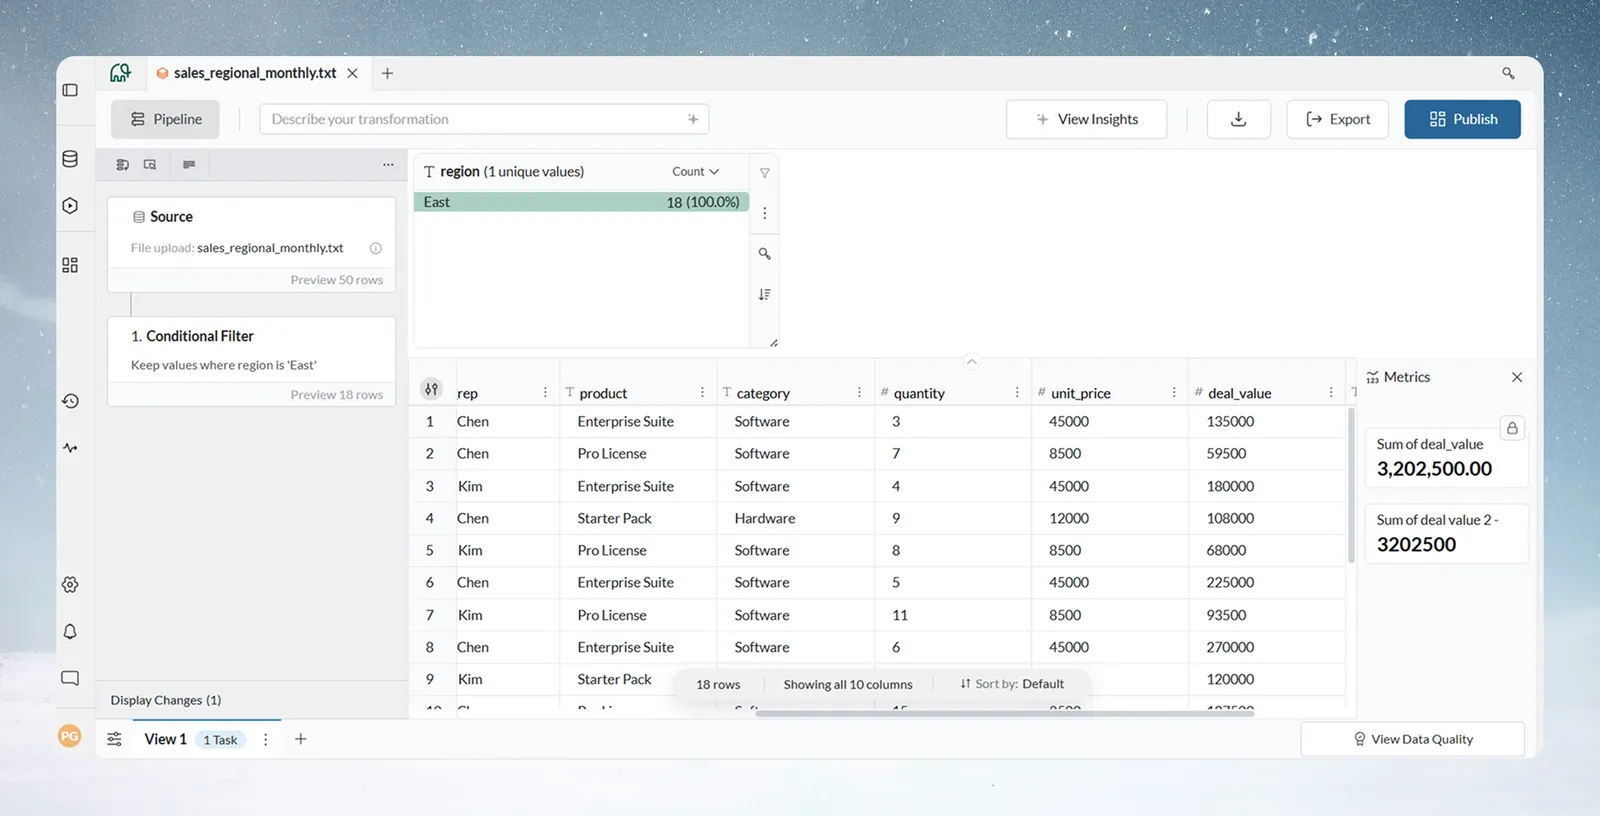
- Create base metric (Total Sales)
- Lock the metric—preserves original value
- Apply filter (Region = East)
- Create an identical unlocked metric—shows filtered value
- Compare: $3.2M Total vs $1.1M East = 34% of business in East
Running trend analysis
- Create time-based metric (Monthly Revenue)
- Filter by sequential months (Jan, Feb, Mar)
- Watch metrics update for each period
- Identify patterns (growth, decline, seasonality)
Troubleshooting
Metric shows zero or error
Problem: Metric displays 0 or an error message.
Solutions:
- Verify you selected the right column
- Sum and Avg only work with numeric columns—check column type
- Review formula syntax—column names must be in double quotes:
SUM("column_name") - Check for null values that may affect the calculation
Metric doesn't update with filters
Problem: Metric stays the same when applying filters.
Solutions:
- Check the lock icon—locked metrics do not update. Click to unlock.
- Verify the filter badge beside the Explore toggle shows an active filter
- Refresh the View if needed
Next steps
- Explore Cards—interactions: combine multiple filters for deeper segmentation.
- View Insights: let AI summarize patterns in your data.
- Automations: refresh data on a schedule to keep metrics current.