Key features overview
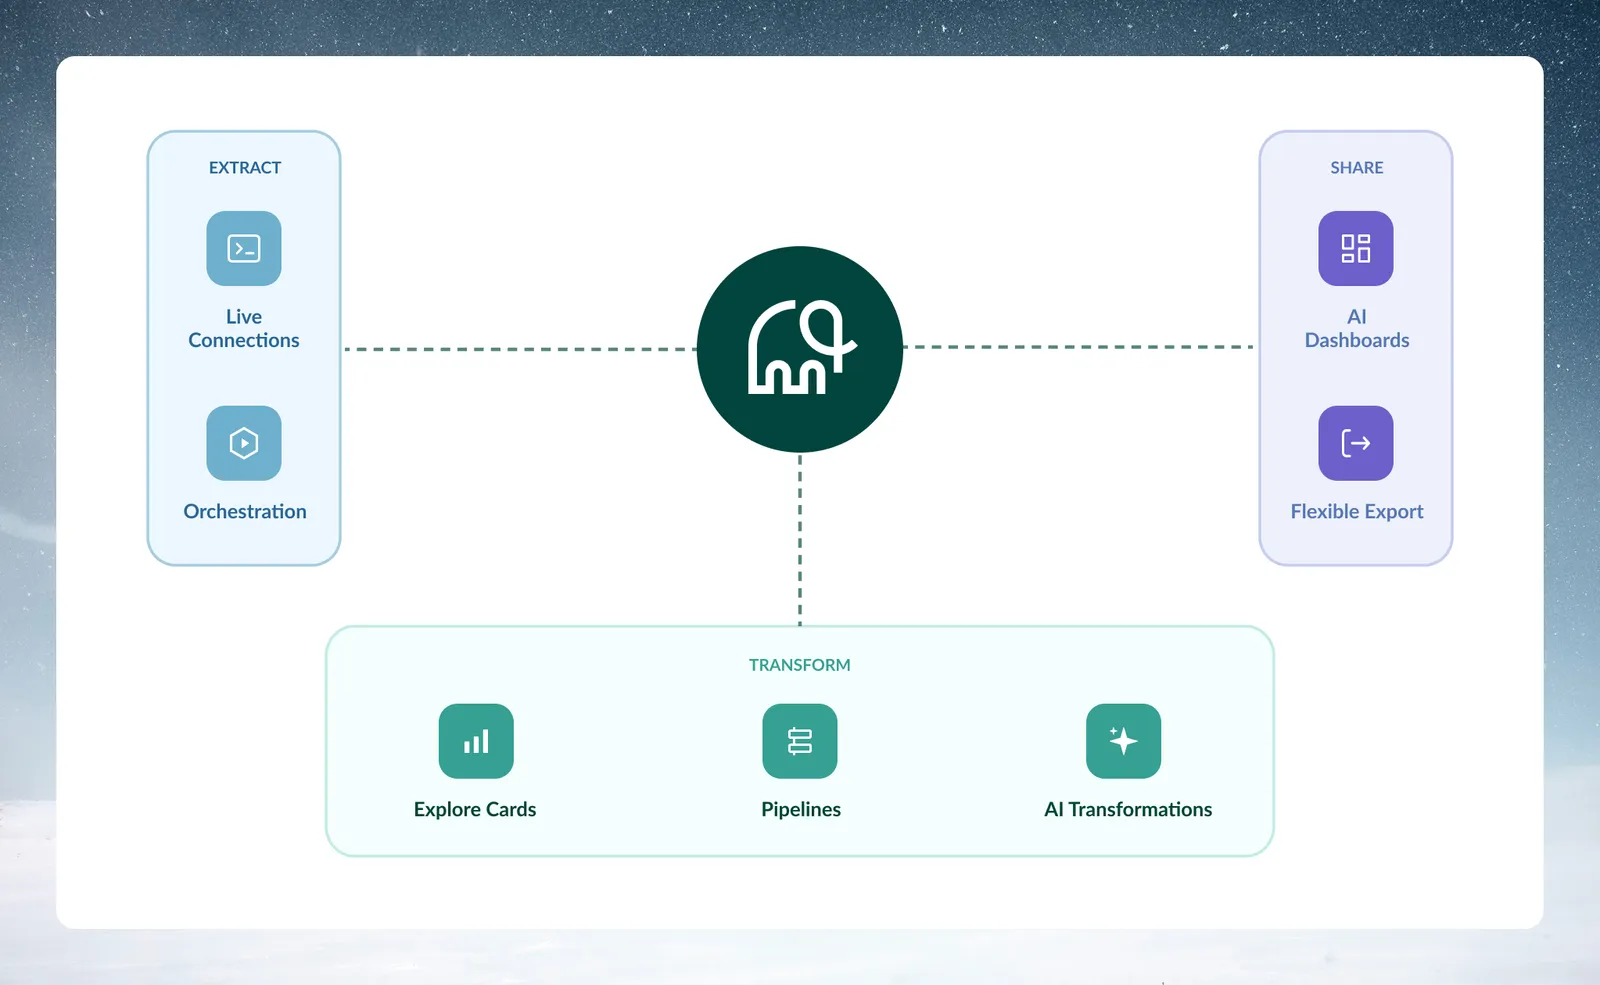
This page summarizes the seven core Mammoth capabilities for anyone evaluating the platform or starting out. Each section names a capability and links to where to learn more. To try them in sequence, start with the Quick start.
Visual pipeline development
Build reusable pipelines from transformation functions in organized menus, without writing code. Select a function, configure it through a form, and see the results. Each pipeline task executes in order from top to bottom, which gives a transparent record of your transformation logic.
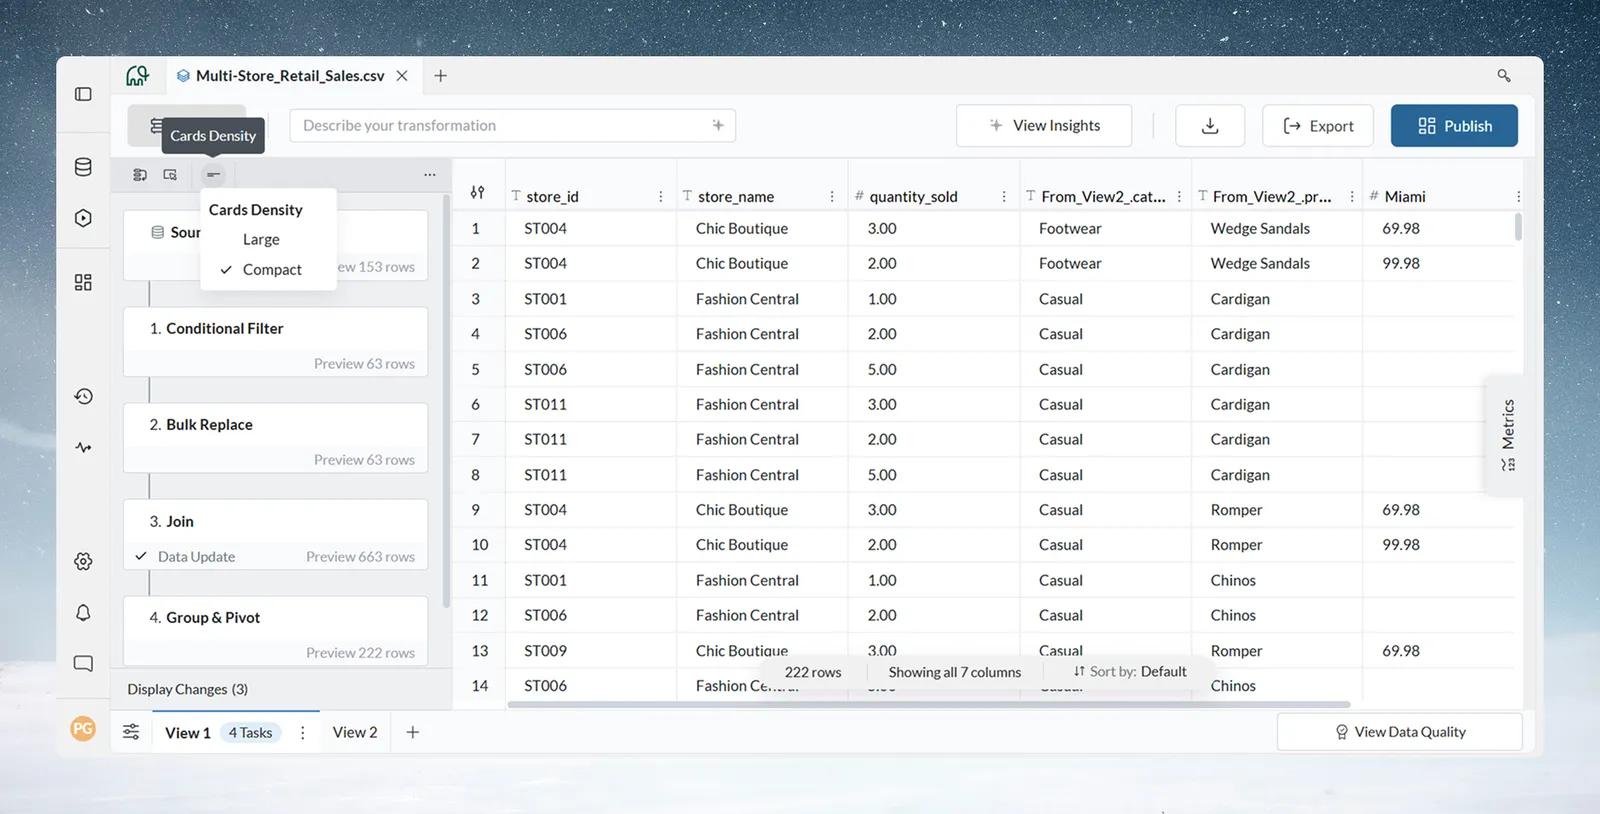
You can review any task, see the exact logic applied, and modify it without technical expertise. A pipeline you build once applies to new data. Examples are daily sales reports and monthly consolidations.
Build pipelines with your actual messy data rather than clean examples. Transformation functions cover common data quality issues such as inconsistent formatting, duplicate records, and missing values.
AI-powered transformations
Describe what you want in natural language in the Describe your transformation box and Mammoth generates the pipeline tasks.
For example, type "remove rows where product name contains 'test' and standardize dates to MM/DD/YYYY format" and Mammoth's AI generates the matching tasks. It can create multi-task workflows you would otherwise build manually through function menus.
AI is also used in individual functions. The Extract Text function uses AI pattern recognition for unstructured data. AI-powered Bulk Replace groups variations like "iPhone 15 Pro," "iphone 15 pro," and "iPhone15Pro" for standardization.
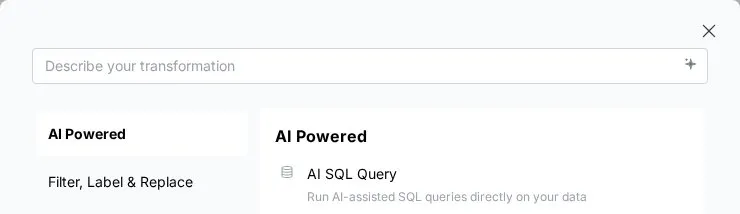
You can review, modify, schedule, and reuse the pipelines the AI creates.
Explore Cards: column insights at a glance
Every column in your dataset gets an automatic visualization and statistical summary when you open a View, with no configuration.
Explore Cards are interactive and show distributions, patterns, and quality issues. Text columns display vertical bar charts of distinct values sorted by frequency. Numeric columns show horizontal bar charts with intelligent granularity (multiples of 10, 100, 1000). Date columns provide temporal charts with automatic hierarchy selection (years, months, days, hours).
Click any value in an Explore Card to highlight it with menu options. Double-click to create filter pills that update all cards and the data grid. Discoveries become repeatable processes, because you can convert temporary filters into permanent pipeline tasks.
Each card also shows completeness statistics, null percentages, and distinct value counts.
Live Connections to your data sources
Connect directly to databases, cloud applications, and APIs without downloading files, so data stays current without manual exports.
A Live Connection is a configured link between Mammoth and a data source. Supported sources include Salesforce, PostgreSQL, Google Sheets, other databases, cloud applications, analytics platforms, and file sources. Credentials are encrypted and scoped to individual projects.
You can combine multiple sources in the same pipeline, for example by joining Salesforce opportunities with PostgreSQL financial data and Google Sheets tracking. Schedule automatic data refreshes so reports reflect current data.
For connectors that support it, set the Update method to Add new data with a Key column so only new data is added instead of reloading the entire dataset.
AI-powered dashboard creation
Describe the dashboard you want and Mammoth's AI generates an interactive dashboard with charts, metrics, and filters. The AI analyzes your data structure, identifies key metrics, and suggests different dashboard approaches, such as an executive summary or an analytical deep dive, so you can choose the one that matches your audience.
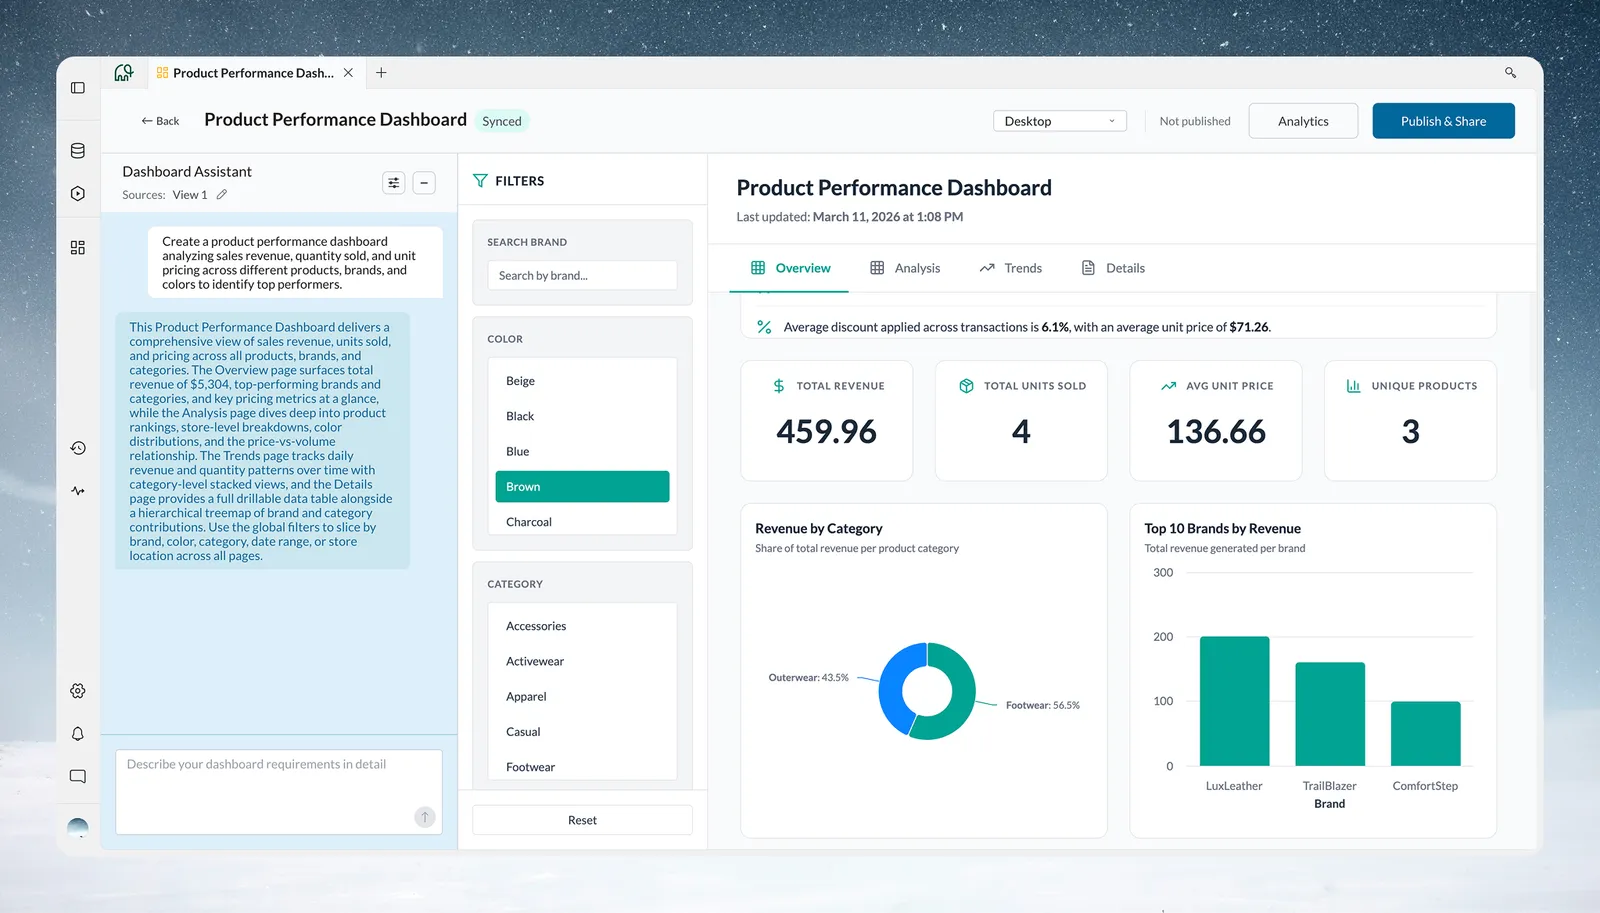
Share dashboards with Anyone with the link (no sign-in required, for external stakeholders) or Sign-in required (for your team).
Automations
Automations schedule, coordinate, and monitor data workflows that run without manual intervention.
Schedule Dataset Refresh automations to pull updated data from Live Connections daily, weekly, or monthly. Use Data Consolidation automations to combine file uploads from multiple locations. Configure Messaging automations with email notifications and CSV attachments to deliver reports to stakeholders.
Run related Dataset Refreshes In a sequence or In parallel. Track running and past runs in Monitor.
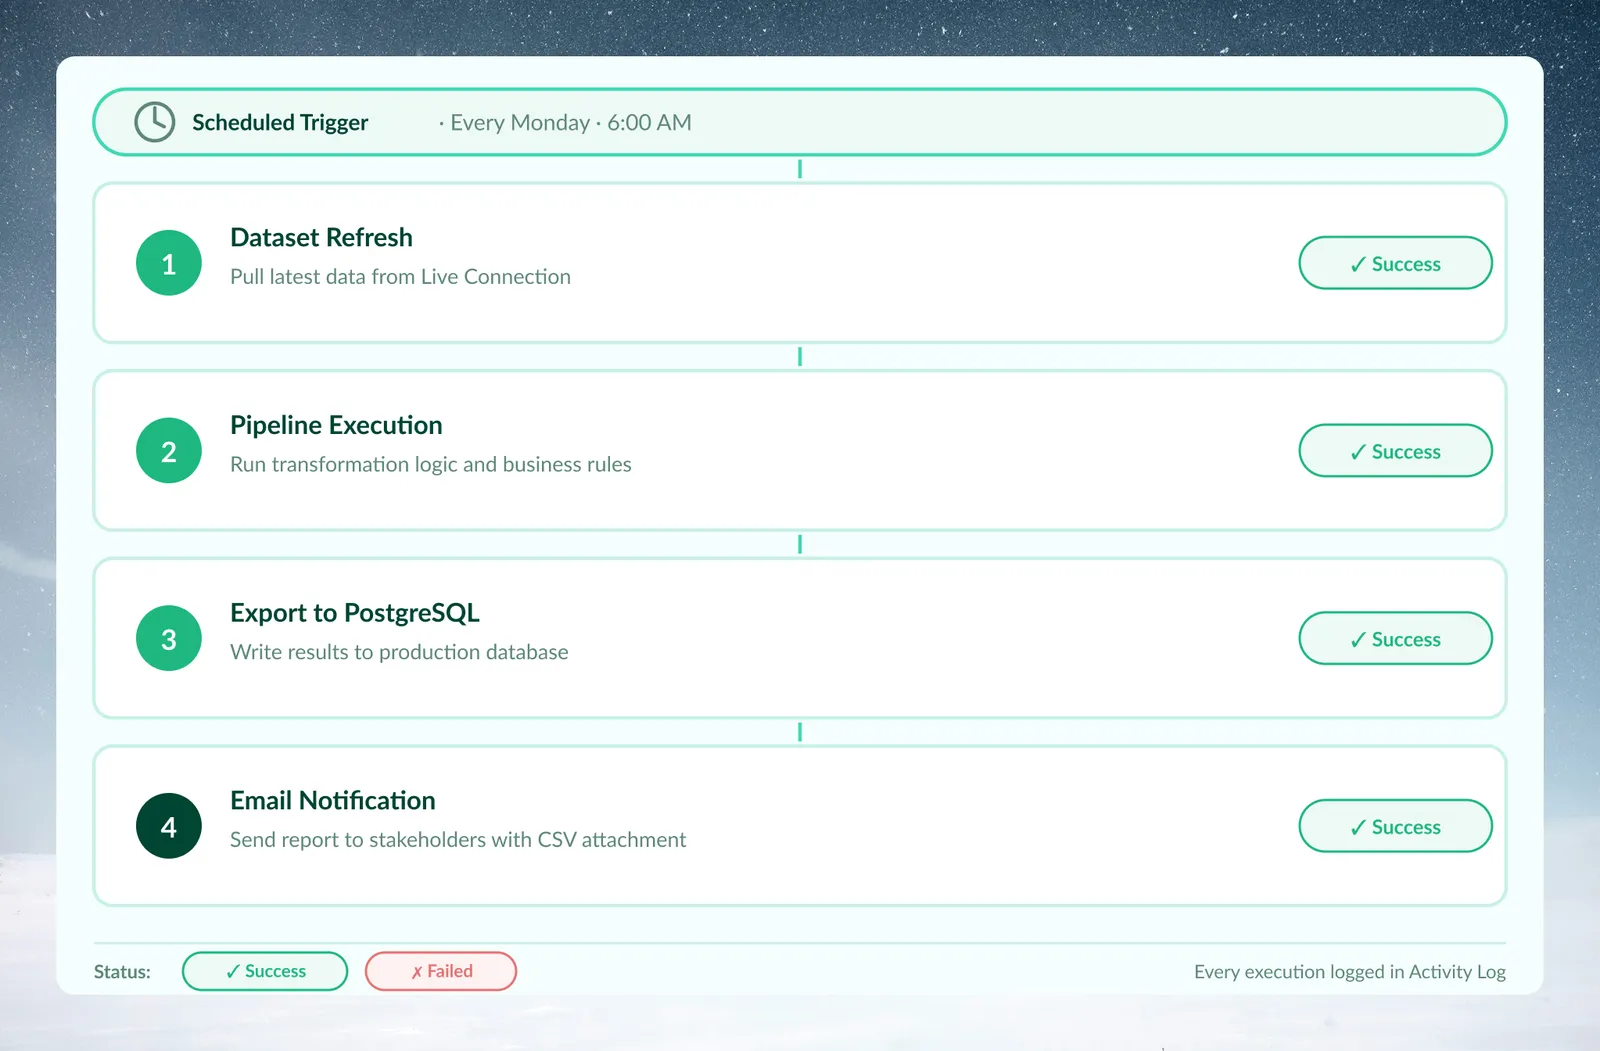
Once set up, an automation runs on its schedule.
Flexible export and sharing
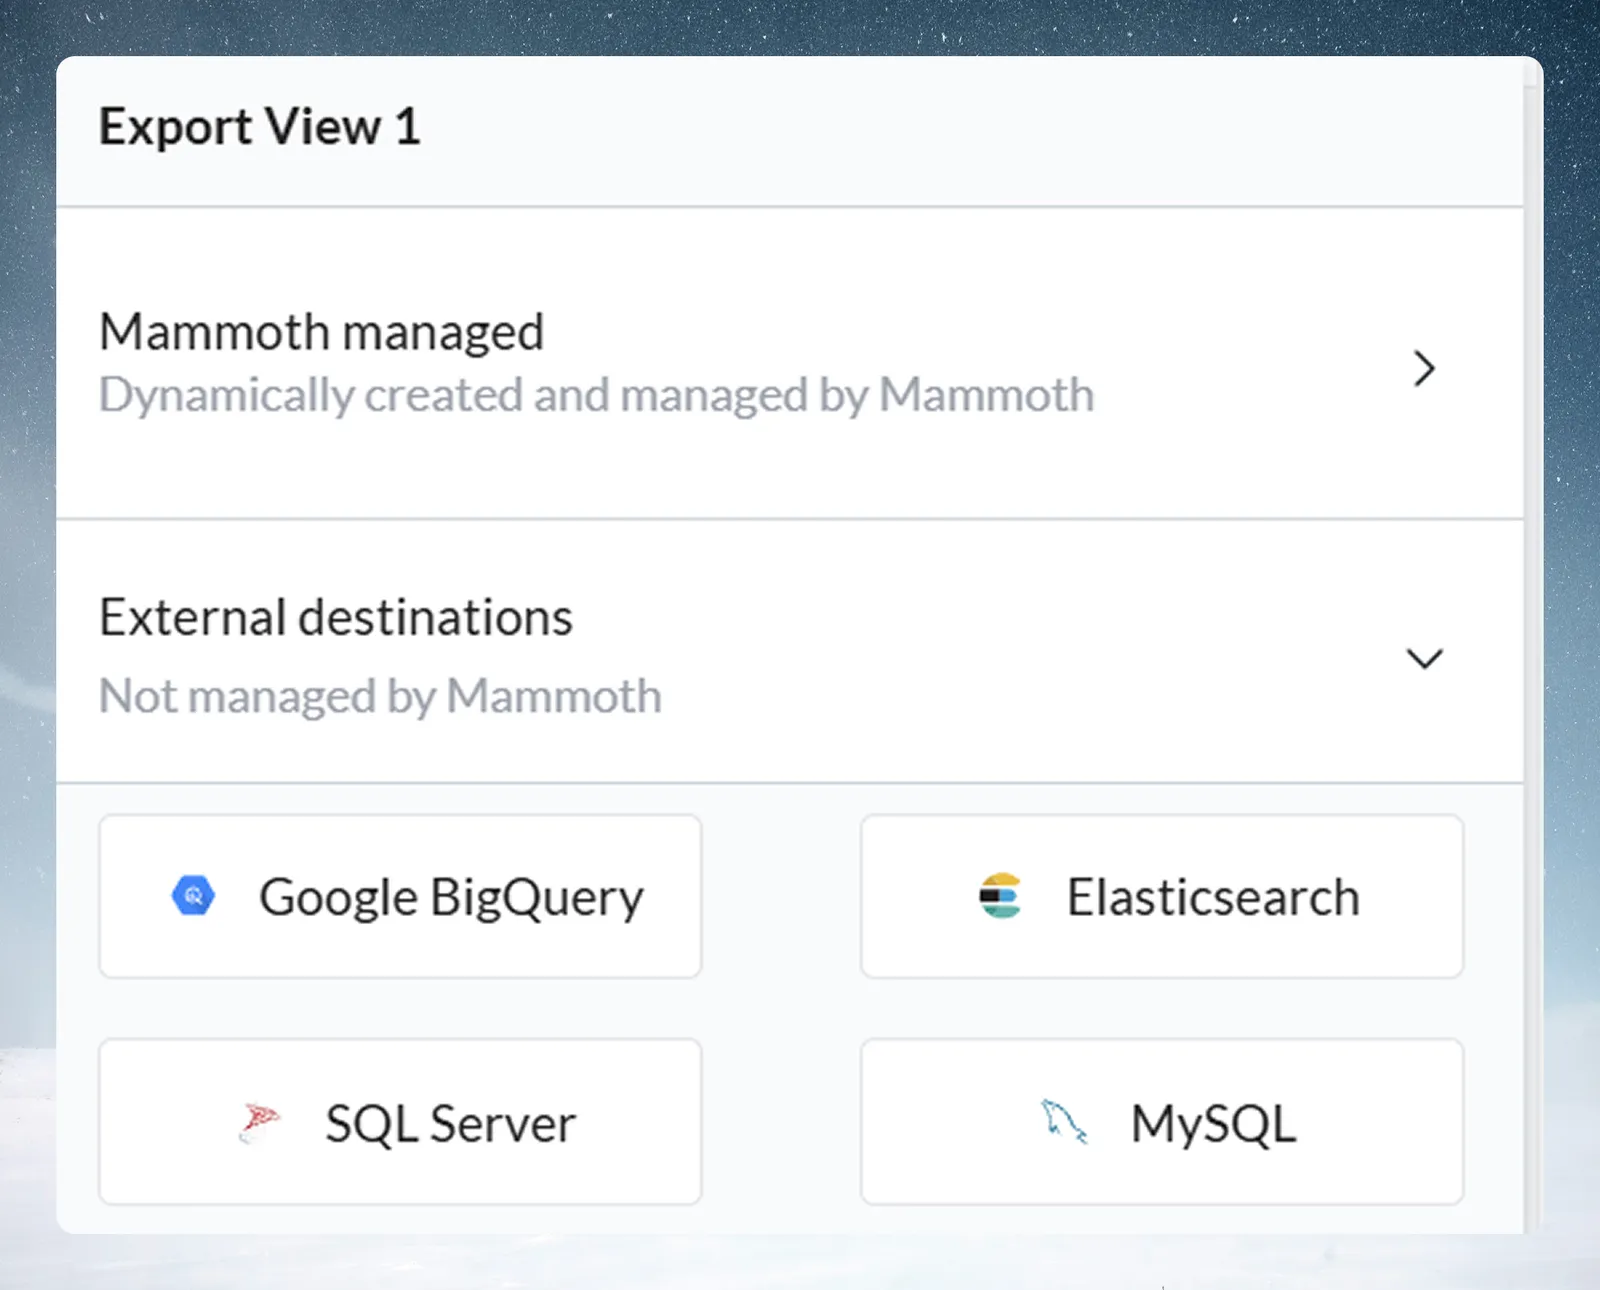
Export sends data to Mammoth-managed destinations or external systems. Mammoth supports two export paths.
Mammoth-managed export destinations
-
Send to Dataset: Push results from your current view into a new or existing dataset for reuse.
-
Live Link: Generate a secure, shareable URL that automatically reflects the latest data.
-
Managed Databases: Publish directly to supported databases managed within Mammoth (e.g., PostgreSQL, BigQuery).
External export destinations
Export data to systems outside Mammoth, including:
-
Google BigQuery
-
PostgreSQL
-
MySQL
-
SQL Server
-
Amazon Redshift
-
Elasticsearch
-
SFTP
-
Azure Blob
-
OneDrive and SharePoint
-
Tableau Server/Cloud
-
REST API Export
You can prepare and transform data once, then deliver it to operational databases, analytics environments, or external systems.
A Live Link avoids file attachments and version confusion, because the link reflects current data.
How the capabilities work together
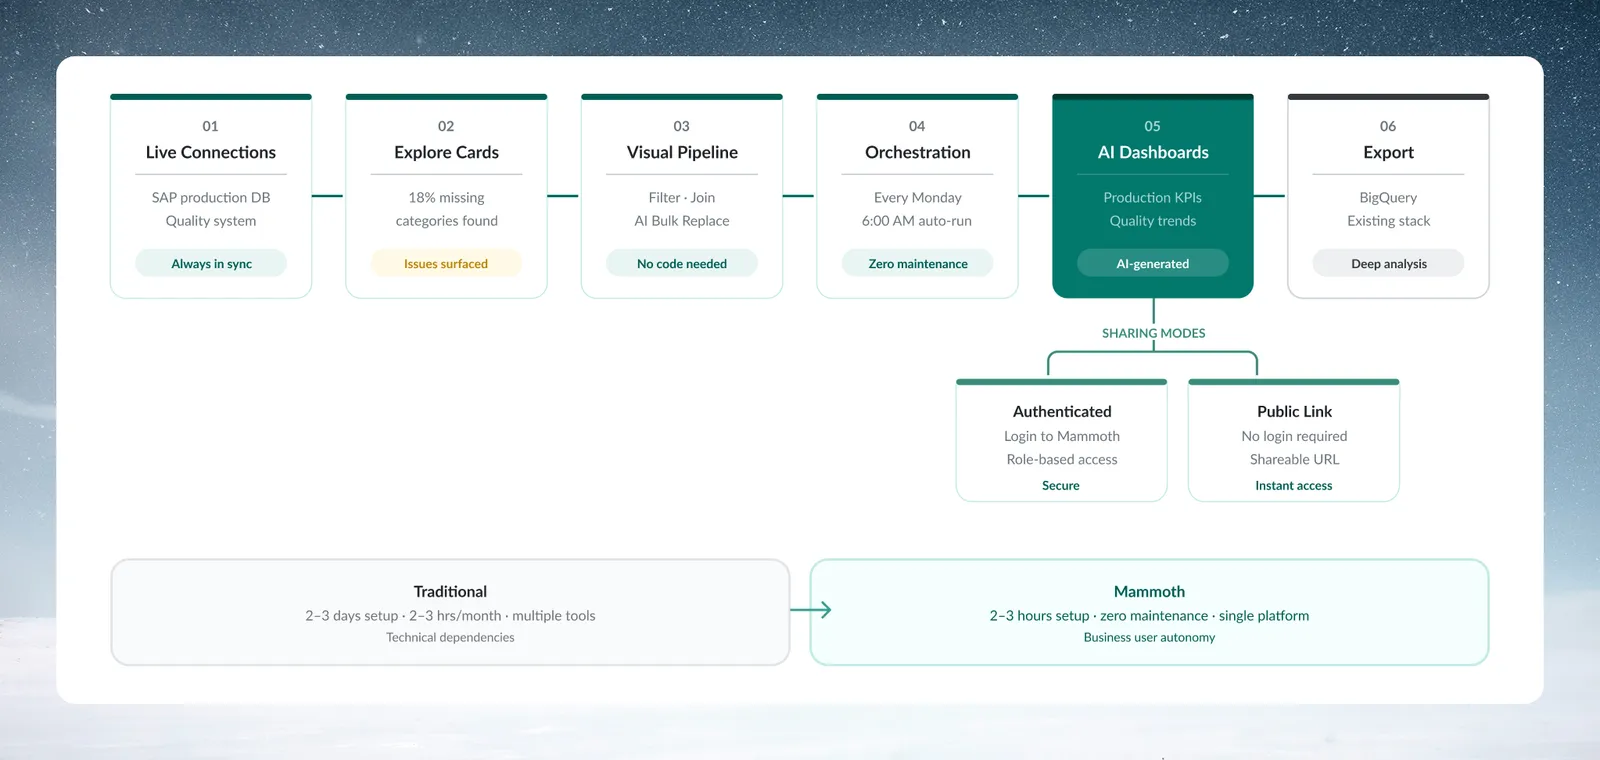
The seven capabilities combine into a workflow from raw data to shareable insight. This illustrative example describes a manufacturing team.
The team starts by connecting Live Connections to their SAP production database and quality management system. Explore Cards reveal many records with missing product categories. They build a visual pipeline that filters out test records, standardizes vendor names with AI-powered Bulk Replace, joins production data with quality metrics, and calculates defect rates by product line.
They convert that exploration into an automation. Every Monday at 6 AM, a Dataset Refresh pulls updated data and the pipeline applies the same transformation logic to new records. An AI-generated dashboard shows production efficiency KPIs and quality trends. The dashboard is shared with Sign-in required for plant managers, who sign in to Mammoth to see current metrics. Results export to their existing BigQuery environment, where the data team performs deeper statistical analysis.
Capabilities at a glance
| Feature | Primary benefit | Audience |
|---|---|---|
| Visual pipelines | Automate recurring workflows | All users |
| AI transformations | Natural language data work | Business analysts |
| Explore Cards | Column profiling | All users |
| Live Connections | Data refreshed from the source | Data engineers |
| AI dashboards | Dashboards from a description | Business analysts |
| Automations | Scheduled, coordinated workflows | Operations teams |
| Export | Send data to other systems | All users |
Next steps
To try these capabilities, follow the Quick start tutorial to build your first pipeline, or read Core concepts to see how the platform is organized.
For feature detail, see Transform data for pipelines, Dashboards for visualization, and Automations for scheduled workflows.